


The currency pair moves sideways in the short term according to the H4 chart, the H&S pattern was invalidated for now, but some good US figures today could bring this chart pattern to life.
The US Non-Farm Payrolls indicator is expected at -22000K, far below the -701K in March, the Unemployment Rate could increase from 4.4% to 16.0%, while the Average Hourly Earnings could increase by 0.5%. The economic figures could be crucial for the dollar, GBP/USD will register a significant movement around these releases.
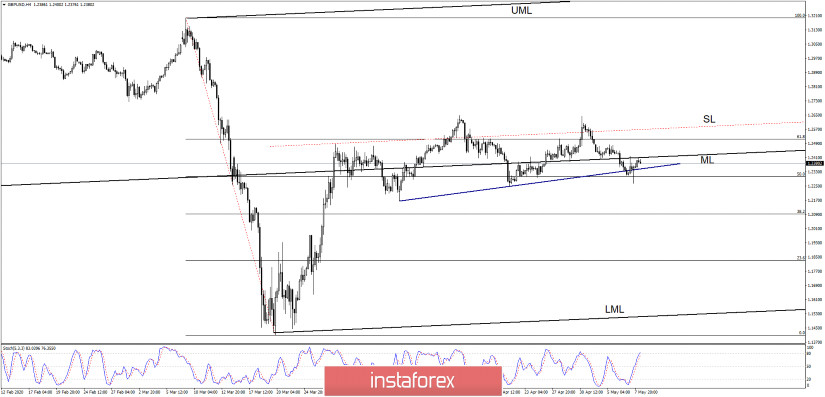
GBP/USD has developed a Head & Shoulders pattern, unfortunately, this formation wasn't confirmed as the price has registered only a false breakdown below the Neckline (dark blue uptrend line) and below the 50% retracement level.
The failure to stabilize above the sliding parallel line (SL) has signaled that the upside movement could be finished and that a downside movement could develop in the days ahead. GBP/USD has come back to retest the median line (ML) as the USD was punished by the USDX's drop.
- TRADING TIPS
We can sell GBP/USD after a drop below the 1.2265 former low, the first major target could be around 23.6% (1.1829) retracement level. So, a valid breakdown below the dark blue uptrend line (neckline) and below the 50% level will confirm a significant drop.
If you want to buy GBP/USD, maybe it would be better to wait for a valid breakout above the inside sliding line (SL - ascending dotted line), and above the 1.2647 high, the target will be somewhere at 1.3199 highest high.


