


On the weekly scale of the tool, from March 2015, you can track the corrective bearish structure, which looks like a stretched plane. The downward wave that dominates the entire current year on the dollar chart has reached the upper limit of the potential reversal zone, where there are several important levels of support. The structure of the wave does not show completeness, which indicates a temporary nature of the stoppage. Nevertheless, taking into account the overall wave sweep, the rise may take a considerable period of time. The first control site is in the local district last week. An optimistic variant of the scenario implies a rise in the rate to the values of June.
In the coming sessions, the completion of the current "outset" is expected and a repeated attempt to change the direction of traffic. The growth of quotations within a day is not expected to exceed the limits of resistance.
The boundaries of the resistance zone:
- 94.10 / 20
The boundaries of the support zone:
- 93.30 / 20
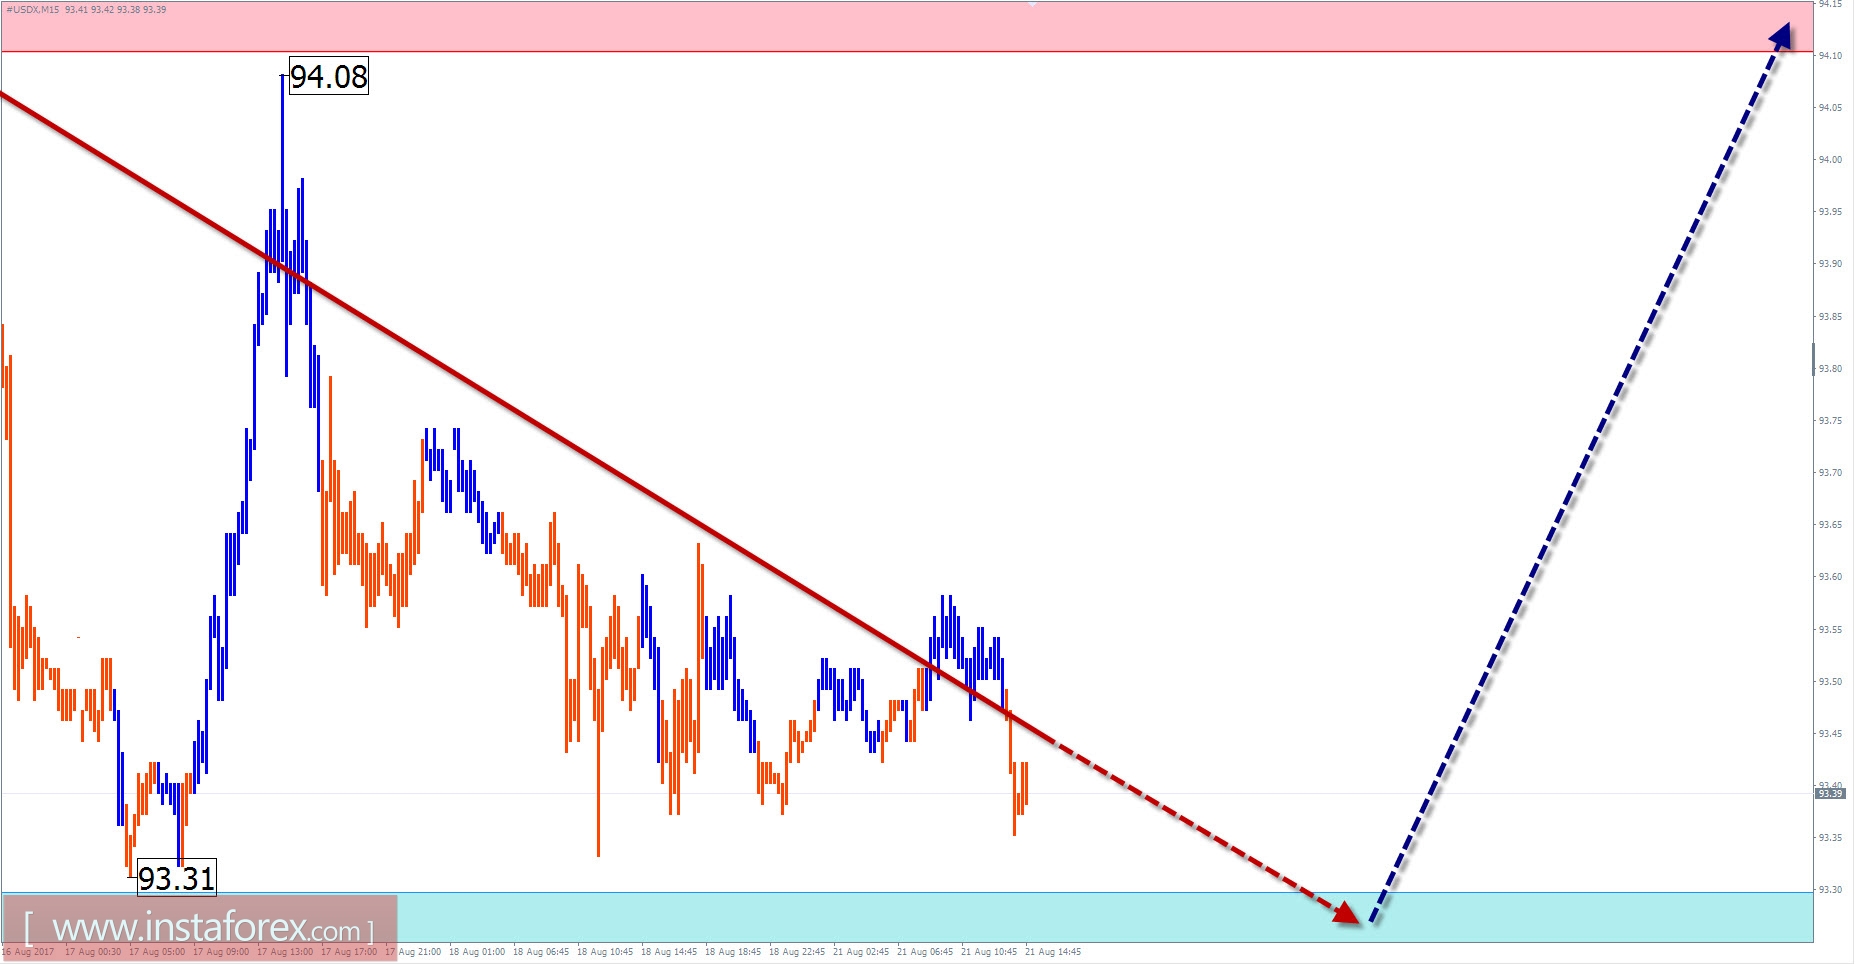
Explanations to the figures: For simplified wave analysis, a simple type of wave is used that combines 3 parts (A; B; C). Of such waves, all kinds of correction are composed and most of the impulses. On each considered time-frame the last, incomplete wave is analyzed.
The zones marked on the graphs are indicated by the calculation areas in which the probability of a change in the direction of motion is significantly increased. Arrows indicate the wave counting according to the technique used by the author. The solid background of the arrows indicates the structure formed, the dotted line indicates the expected wave motion.
Note: The wave algorithm does not take into account the duration of the tool movements in time. The forecast is not a trading signal! To conduct a transaction, you need to confirm the signals used by your trading systems.


