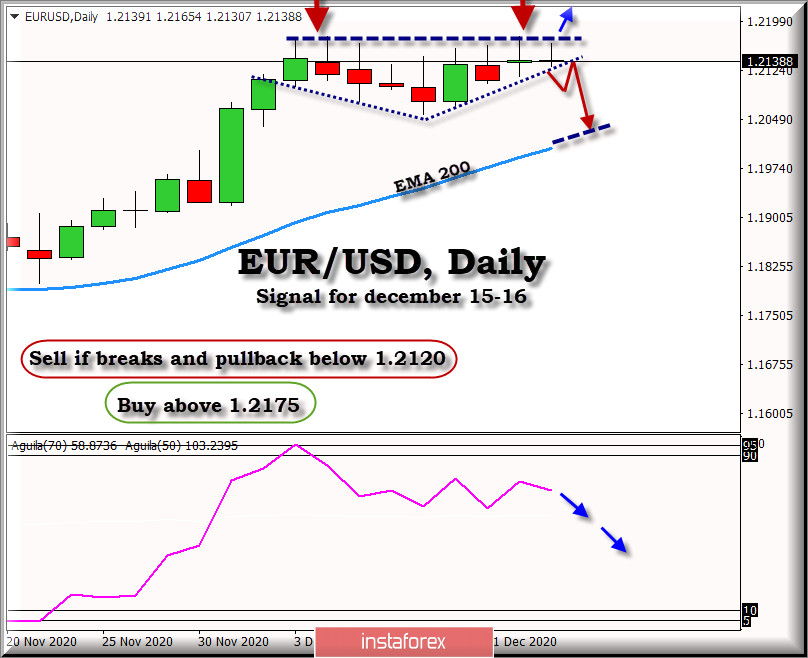
The EUR/USD pair, yesterday in daily charts has left a Doji, a Japanese candle that means that the markets are in balance and there is some caution from both buyers and sellers, for today it remains practically unchanged, just for below the 1.2174 region, an area of strong resistance that could not be broken in previous days.
If you look at the chart, you will notice that EUR/USD in daily charts has a strong resistance at 1.2175, there have been more than two daily attempts to break this level, and it has not succeeded, if the pair does not exceed this zone, we can wait a price correction to the 21-period SMA area at 1.2004.
We also notice a formation of a fractal, in the shape of a V, between the last euro quotes, we have traced a channel for you to visualize this fractal, if the euro-dollar breaks this channel of the daily fractal, it could also be a sign of a correction to the area of the SMA of 21, so we must be alert to a break of this level, if it closes the day below this level, there could be a fall to 1.20.
The eagle indicator on daily charts is in the overbought zone, apparently if the market wants to trade at the 1.23 level for the next few months, we should first expect a correction of the euro for a new upward momentum.
Market sentiment for this morning of the American session is showing that there are 68% of investors who are selling this pair, supporting the bullish force that is prevailing, if this figure decreases, we could see a fall in the Euro for the next few days .

Trading tip for EUR/USD for December 15 – 16
Buy if the pair breaks above 1.2175, with take profit at 1.2207 (8/8 murray), and 1.2268, stop loss below 1.2120.
Sell if the pair breaks below 1.2120, with take profit at 1.2085 (6/8 murray) and 1.2005 (SMA 21 daily), stop loss above 1.2165.


