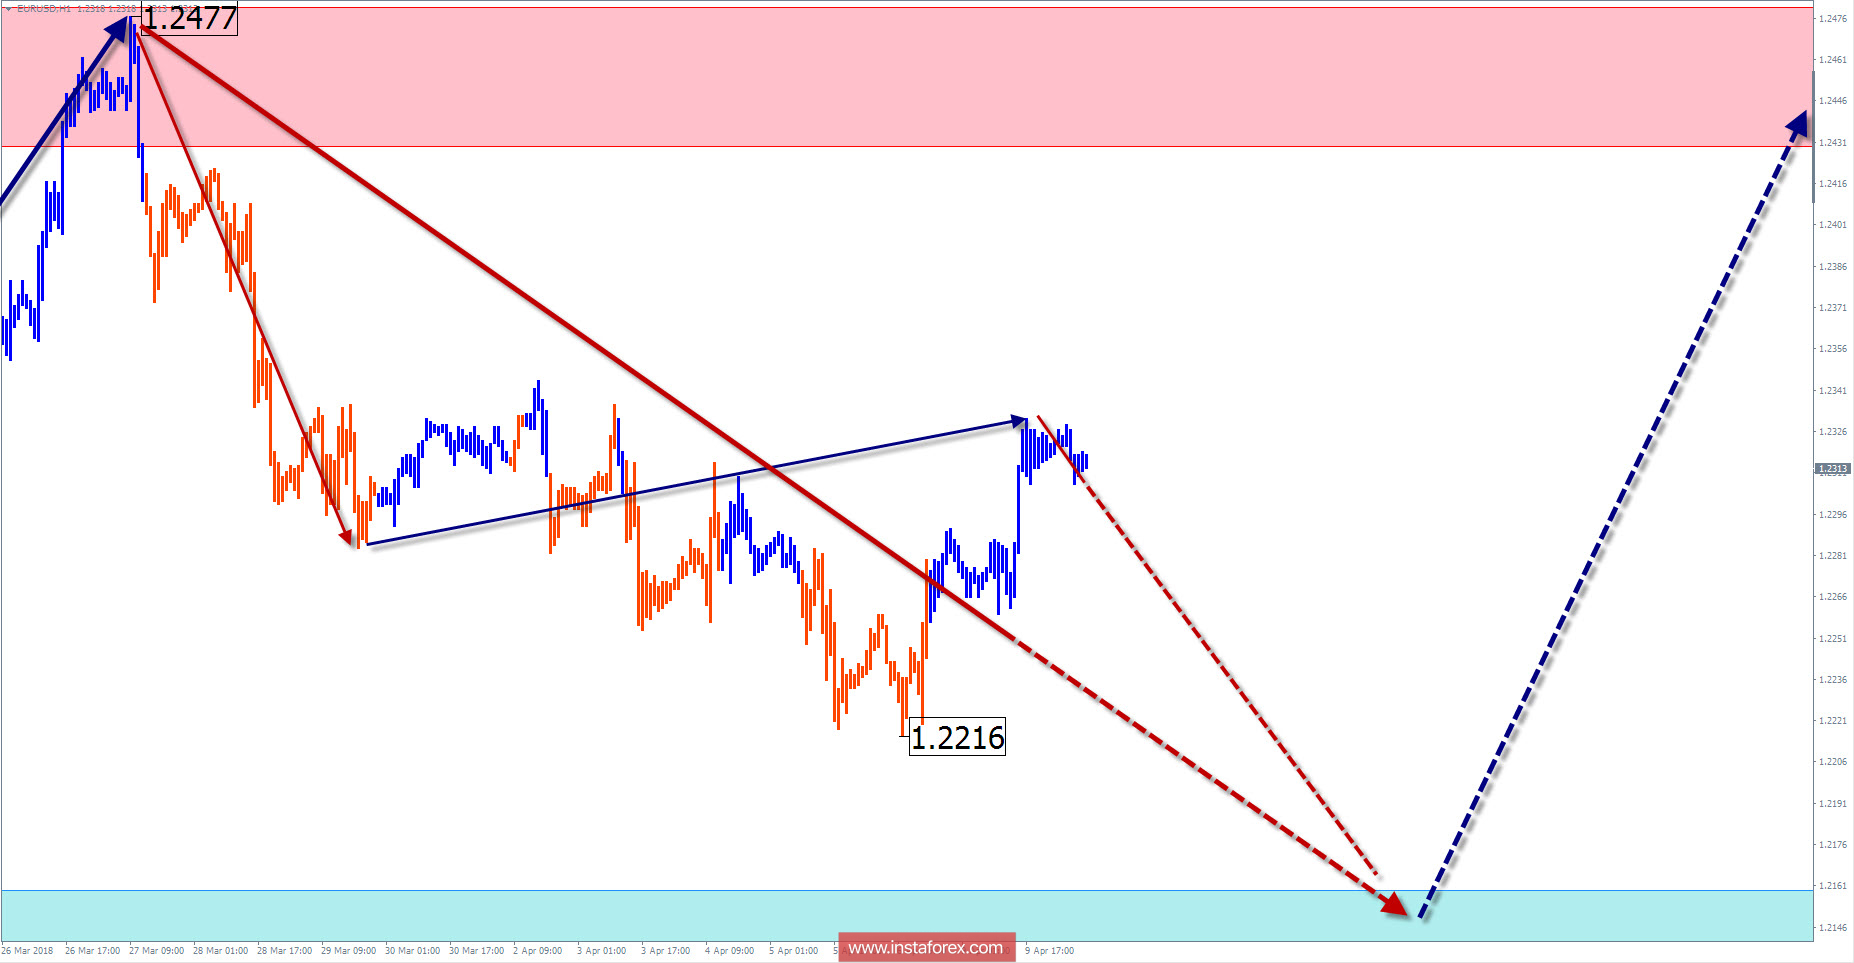
The main movements on the chart of the euro / dollar pair occur within the framework of the main wave model, which has been quoted since March 2015. The extremes of prices formed the incomplete ascending figure "stretched plane". From the beginning of last year, quotes confidently moved up, which corresponded to the impulsive nature of the final part (C). The price segment reached by the beginning of this year is close to a strong level of resistance on a large scale. The contact of the price with him provoked a subsequent lateral correction.
In the coming week, we can expect a further decline in the exchange rate. Judging by the type of bearish wave structure, the range of the downward pathway is unlikely to exceed the lower boundary of the formed lateral channel. Further, there is a high probability of a course change.
The boundaries of resistance zones:
- 1.2430 / 1.2480
The boundaries of support zones:
- 1.2160 / 1.2110

Explanations to the figures: For simplified wave analysis, the simplest type of wave is used in the form of a zigzag, combining 3 parts (A; B; C). Of these waves, all kinds of correction are composed and most of the impulses. At each time frame, the last, incomplete wave is analyzed.
The areas marked on the graphs are indicated by the calculation areas, where the probability of a change in the direction of motion is significantly increased. Arrows indicate the wave counting according to the technique used by the author. The solid background of the arrows indicates the structure formed, the dotted one indicates the expected wave motion.
Attention: The wave algorithm does not take into account the duration of the tool movements in time. The forecast is not a trading signal! To conduct a trade transaction, you need to confirm the signals of your trading systems.


