


To open long positions on EUR / USD pair, you need:
It is quite expected that the PMI indices for the production sector of the eurozone countries continued to show a reduction, which indicates the poor state of the sector. Against this background, it would not be entirely correct to expect any serious activity from the euro buyers. Therefore, the absence of bulls at the level of 1.1034 is quite predictable. In the second half of the day, it is best to return to long positions only after a false breakout at the level of 1.1034 but it is best to look for purchases after updating the next monthly lows around 1.0990 and 1.0954. Majority of it will depend on the ISM US manufacturing index. A bad report may bring back buyers of the euro, which will lead to an update of resistance at 1.1068, where I recommend fixing profits. However, it is hardly possible to expect a larger increase above this level today.
To open short positions on EUR / USD pair, you need:
In the afternoon, sellers will wait for a good report on the US manufacturing index, which will increase the pressure on the European currency and lead to a break from consolidating below the support of 1.1034, which will push the pair further to the lows of 1.0990 and 1.0954, where I recommend taking profits. If the EUR / USD buyers attempt to return to the resistance of 1.1068, the formation of a false breakdown will be a direct signal for the further opening of short positions. Otherwise, you can sell on the rebound from the resistance of 1.1100. In any case, the pair will maintain a short-term bearish trend and so far, there are no signals for its completion.
Indicator signals:
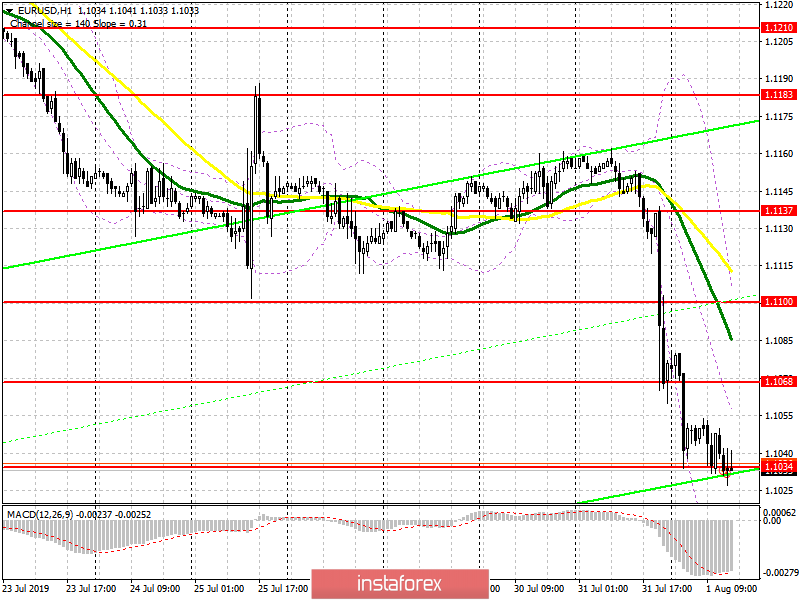
Moving averages
Trading is below 30 and 50 moving averages, which indicates the bearish nature of the market.
Bollinger bands
In the case of an upward correction, the upper limit of the indicator in the area of 1.1078 will act as a resistance, from where you can open short positions immediately to the rebound.
Description of indicators
MA (moving average) 50 days - yellow
MA (moving average) 30 days - green
MACD: fast EMA 12, slow EMA 26, SMA 9
Bollinger Bands 20


