


Trend analysis (Fig. 1).
Continued upward movement is expected, to the level of 1.2956 - resistance line (yellow thin line). In case of breaking through - movement up to 1.3013 - the upper fractal (blue dashed line). From this level, it is possible to move down to target 1.2956 - the support line (yellow thin line).
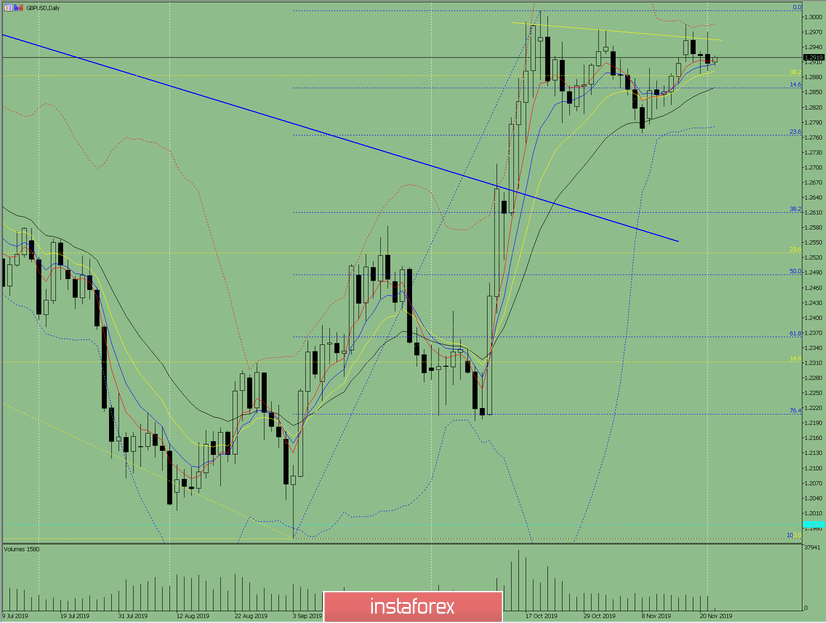
Fig. 1 (daily chart).
Comprehensive analysis:
- Indicator analysis - up;
- Fibonacci levels - up;
- Volumes - down;
- Candlestick analysis - up;
- Trend analysis - down;
- Bollinger Lines - up;
- Weekly schedule - up.
General conclusion:
On Friday, the price may continue to move up.
The first upper target 1.2956 is the resistance line (yellow thin line). In case of breaking through - movement up to 1.3013 - the upper fractal (blue dashed line).
An unlikely scenario is a downward movement with the target at 1.2859 - a retracement level of 14.6% (blue dashed line).


