


Hello, dear colleagues!
Last week was ambiguous for the main currency pair. The currency held in the range of 1.1040-1.1115 during the trading on December 2-6 and closed the week at 1.1060. Thus, the strong technical level of 1.1080 was not passed again.
Before proceeding in more detail to the technical section of this article, a little about the significant and important statistics that have been and will be published this week.
I will start with Friday's data on the US labor market, which was mixed. A strong report on the creation of new jobs in the non-agricultural sectors of the economy (266 thousand against the forecast of 180 thousand), as well as the decline in the unemployment rate from 3.6% to 3.5%, spoiled the low growth of wages (0.2%, 0.3% forecast). I would like to note that this is not the first time. Growth in average hourly earnings has traditionally been a weak link in US labor reports.
However, lower unemployment and strong reports on Nonfarm Payrolls allowed the US dollar to strengthen against the single European currency.
This week, we expect the publication of important data from the United States, among which it is necessary to note the Fed's decision on rates and updated economic forecasts of the FOMC, consumer price index, retail sales, changes in producer prices, as well as primary appeals of Americans for unemployment benefits.
In the Eurozone, the main event will be the ECB's decision on rates and the press conference of the head of the European Central Bank Christine Lagarde. It is also worth paying attention to the data on industrial production, the index of sentiment in the business environment from the ZEW Institute.
The date, time and forecasts for these and other events can be seen in the economic calendar.
Let's start with the weekly EUR/USD charts.
Weekly
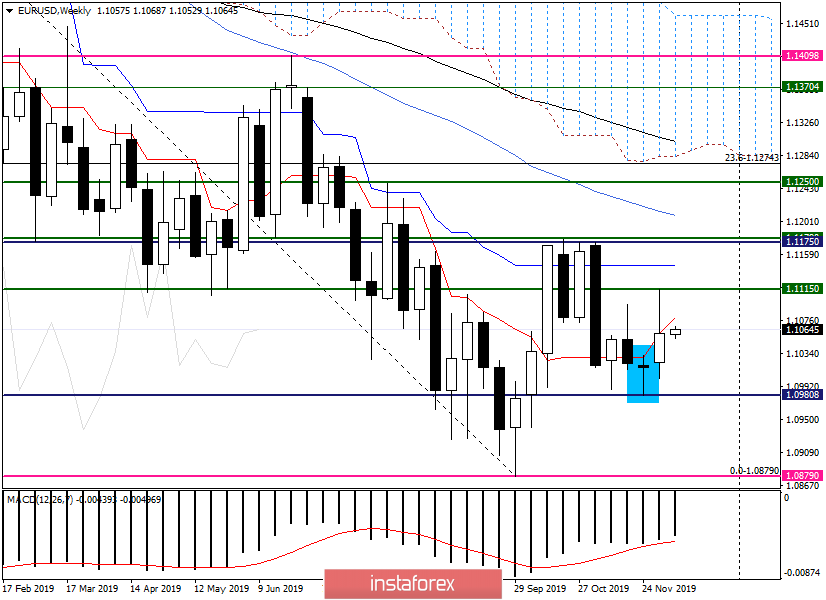
Although trading on December 2-6, the quote ended with growth, the long upper shadow of the candle and the closing price below 1.1080 indicate that the euro still has problems with the course moving in the north direction.
Additional resistance to the rise of the pair is provided by the Tenkan line of the Ichimoku indicator.
As already noted at the beginning of the article, the last five-day trading took place in the range of 1.1040-1.1115, the exit from which is likely to determine the further direction of the euro/dollar.
The beginning of weekly trading is held on a moderately positive note. The pair is trading slightly higher near 1.1062. In the case of continued growth, the nearest resistance may be provided by the Tenkan line, which passes at the well-known and important mark of 1.1080. However, the passage of this level will not answer the unambiguous bullish sentiment for EUR/USD, for this, it is necessary to update the previous highs at 1.1115 and close the weekly trading above.
The bearish scenario will signal a decline to the important psychological and technical level of 1.1000 and the closing of the week below this mark.
Daily
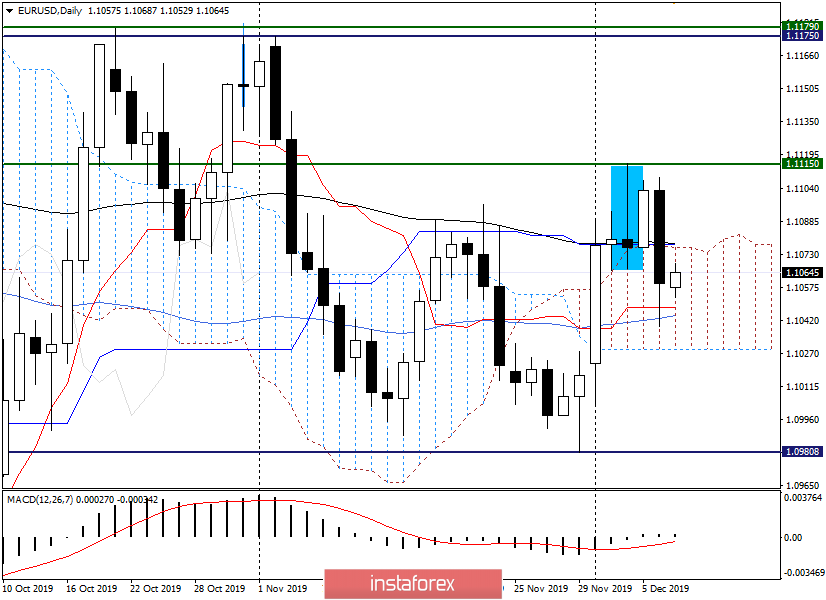
The daily chart is more bearish. This is indicated by the candle for December 4 and a strong decline on Friday. At the same time, trading on December 6 ended within the Ichimoku cloud.
At the moment, the situation is as follows. Support near 1.1045 is provided by 55 MA and Tenkan. Resistance is represented by the upper boundary of the Ichimoku cloud, the Kijun line, and the 89 exponential moving average. It is characteristic that all of these resistances are close to the ill-fated level of 1.1080 for bulls.
If today's candle is formed in the form of a bearish model under 1.1080, we try to sell with a stop above 1.1115 and the nearest targets at 1.1040 and 1.1030.
In the case of the pair's exit up from the cloud, as well as a true breakdown of Kijun and 89 EMA, on the rollback to 1.1080, we try to buy with targets at 1.1115, 1.1150 and 1.1175. At the same time, we take out the stop for the lows on December 6, the level of 1.1039.
At the moment, such trading ideas on the main currency pair. Tomorrow, we will look at smaller timeframes and try to find clearer points to enter the market.
Have a nice day!


