


From a comprehensive analysis, we see an inertial upward move that did not spare short positions and brought the quote back to the boundaries of the previously passed oblong correction. Now, about the details. The Mariana trench, which is what traders dubbed the V-shaped oscillation, where it took only 6.5 trading days to reverse, and 14 days to descend. A remarkable point was that during the descent, there were no rollbacks and corrections. All the movement was inertial. In the second case, there was an acceleration, which led to a reduction in the return time by half. In fact, the naked eye can see the overheating of long positions. However, the market does not care. It goes further, locally exceeding the level of 1.1080. I do not think it is worth keeping the theory of downward development, but in view of such a significant risk, you need to be insured and throw off excess volumes.
Many experts refer to the fact that this movement is a temporary surge in the market, where circumstances have overlapped. However, the general depressing background for the single currency has not gone away, and will still return to its original course. This assumption has a lot of indirect evidence, where the information background has inflated interest in the coronavirus. The stock market which somehow got sideways under the influence of this virus and adjusted for quite different reasons. However, what remains unchanged is the deterioration of the situation in the eurozone economy, where everyone wakes up sooner or later.
In terms of volatility, we see the same acceleration that was discussed above. The quote retains the impulse behavior, where the daily average beats on a daily basis. In fact, everything that happens can be called FOMO (lost profit syndrome) since there is no other explanation.
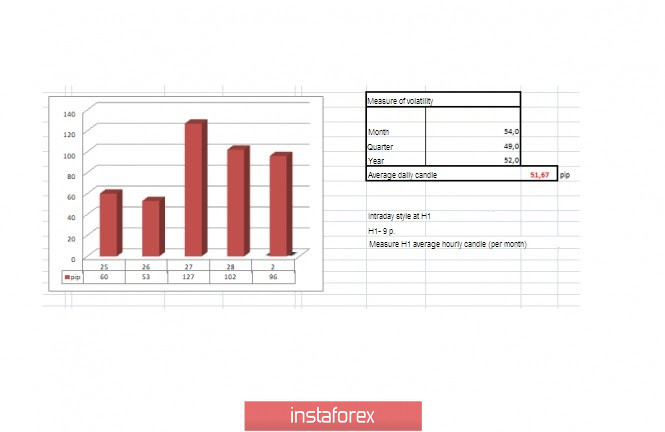
Volatility details: Thursday-127 points; Friday-102 points. The average daily indicator relative to the volatility dynamics is 51 points (see the volatility table at the end of the article).
Analyzing the Friday day every minute, we see that the pullback was still in the period of 11:30-16:30, where the quote returned to the value of 1.0950. However, after everything resumed, we rushed back to the maximum point of the day.
As discussed in the previous review, traders divided into two factions: some talking about a technical correction, others considering the move to the next level of 1.1080, where it was possible to earn in both cases.
Looking at the trading chart in general terms (daily period), we see something similar, where a V-shaped oscillation was formed, with high volatility. However, the main trend resumed in the end.
Friday's news background included preliminary data on inflation for a number of EU countries, where the expected indicators did not come out in the best light, except for Germany, where everything is unchanged at 1.7%. In terms of American statistics, we see that personal income increased by 0.1%, and spending by 0.4%, which is not something drastic. At the same time, wholesale inventories in the United States decreased by 0.2% according to preliminary data.
We can't say that the statistics helped strengthen the euro. This whole background was somewhere nearby, but definitely not in the flow of quotes.
In terms of the general information background, we had one of the strongest noises raised against the background of the "fall" of the US stock market and the coronavirus, where the media seemed to break down, throwing all the loud, terrible headlines. On this noise, unscheduled statements from high-ranking officials began to appear. So, the head of the Federal Reserve System, Jerome Powell, announced the readiness of the Fed to begin measures to support the economy
"The Federal Reserve is closely monitoring events and their consequences for the economy. We use our tools for the necessary steps to support the economy," Jerome Powell said.
His words were immediately used as a kind of weapon, shouting about new rounds of interest rate cuts.
Against such a thick background, US President Donald Trump could not resist saying that regardless of the impact of the coronavirus and the stock market, the Federal Reserve should lower the interest rate to support the economy.
As we can see, there is a characteristic wave, on the crest of which fear and emotions reign, which make up such virtuoso leaps on the market.
Today, in terms of the economic calendar, we have data on the index of business activity in the manufacturing sector of the eurozone, where we recorded an acceleration from 49.7 to 49.8. In the second half of the day, the index of business activity in the manufacturing sector from the US ISM is expected to decline from 50.9 to 50.4. At the same time, talks will start today in Brussels with the participation of the main characters Michel Barnier from the EU and David Frost from Britain. Any noise on the subject of trade relations can lead to a surge in the market, and if you consider that there are quite a lot of disagreements, then it is likely to hear criticism, which will lead to a weakening of the euro.
Further development
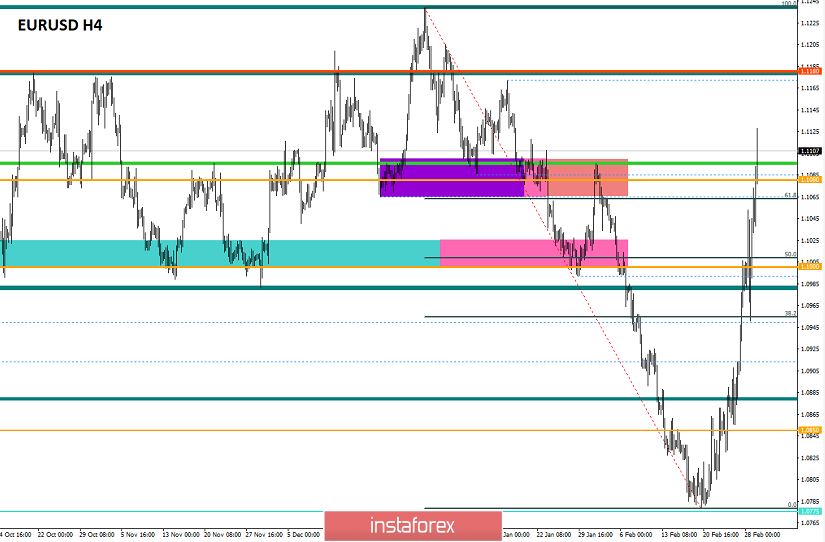
Analyzing the current trading chart, we see that the quote literally broke the level of 1.1080 without stopping, returning us to the area of January this year. In fact, there is already a signal of a possible return in the form of a rollback or correction, so you need to be ready to change trading positions for sale. In the article above, I described the speed of the existing upward move in comparison with the decline before. We see a kind of discrepancy since statistics confirm that the decline is always faster than the growth. Thus, the process will be very fast in terms of reduction. I want to clarify that now we are talking about a pullback/correction since the quote needs to calm down in terms of the background and return to the area below 1.0950.
In terms of emotional mood, a high coefficient of speculative positions is visible, as well as a characteristic FOMO syndrome.
Detailing the available period every minute, we see that the turn of the upward movement occurred at the opening of the European session, where at the moment the quote managed to reach the level of 1.1128.
In turn, traders who had growth prospects to 1.1080 have already left their positions and now the benchmark is for a correction.
It is likely to assume that the technical correction/rollback is already close and against the background of such a significant overheating, we will return to the area of 1.1080, and possibly lower.
Based on the above information, we will output trading recommendations:
- Buy positions are risky to consider since the quote is already very high.
- Sell positions in the form of a technical correction are considered during the change of trading interest, possibly for smaller periods, with a perspective 1.1080-1.1065-1.1040.
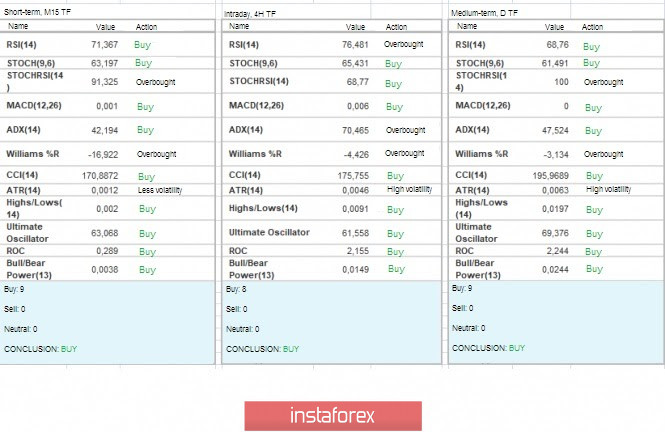
Indicator analysis
Analyzing different sectors of timeframes (TF), we see that the indicators of technical instruments are on the background of an inertial course, having a single buy signal. It is worth taking into account that during the technical correction, indicators for minute and hour periods will quickly change their values.
Volatility for the week / Volatility Measurement: Month; Quarter; Year.
The volatility measurement reflects the average daily fluctuation from the calculation for the Month / Quarter / Year.
(March 2 was based on the time of publication of the article)
The current time volatility is 96 points, which is already 88% higher than the daily average. It is likely to assume that volatility is already high and further development will take place within the existing framework.
Key level
Resistance zones: 1.1180; 1.1300**; 1.1450; 1.1550; 1.1650*; 1.1720**; 1.1850**; 1.2100.
Support zones: 1.1080**; 1.1000***; 1.0950**; 1.0850**; 1.0775*; 1.0700; 1.0500***; 1.0350**; 1.0000***.
* Periodic level
** Range level
*** Psychological level
***** The article is based on the principle of conducting a transaction, with daily adjustments.


