


Good day, dear colleagues!
This morning, the Reserve Bank of Australia (RBA) decided to maintain the basic interest rate at 0.25%, following the results of its meeting.
The RBA said in a statement that there was a decrease in the volume of buying up new bonds, which amounts to 50 billion US dollars. According to the bank's management, the situation on the government bond market is improving. At the same time, the bank noted its readiness to again increase the volume of asset purchases and take further necessary steps in the event of a deterioration in the situation, as well as to achieve the set inflation indicators and to support the labor market.
The Australian Central Bank acknowledged the difficult environment in which the country economy is located and the further uncertainty caused by the negative impact of COVID-19. RBA experts predict a decline in industrial production within 10% in the first half of the year, according to the bank's management, the industrial sector will be shortened by about 6%.
Over the next few years, inflation expectations will continue to be below 2%. Given all the difficulties of the current period, the RBA will continue to keep rates at low levels and is ready to support small and medium-sized businesses, as well as private households.
In principle, such a decision by the Australian regulator was quite expected for market participants. Now all the world's leading central banks are pursuing a super soft monetary policy and are ready to provide extra cheap loans to support the economy in their countries.
Let's see how the Australian dollar reacted to these events, but we begin the technical analysis of the AUD / USD currency pair by summing up the results of past weekly trading.
Weekly
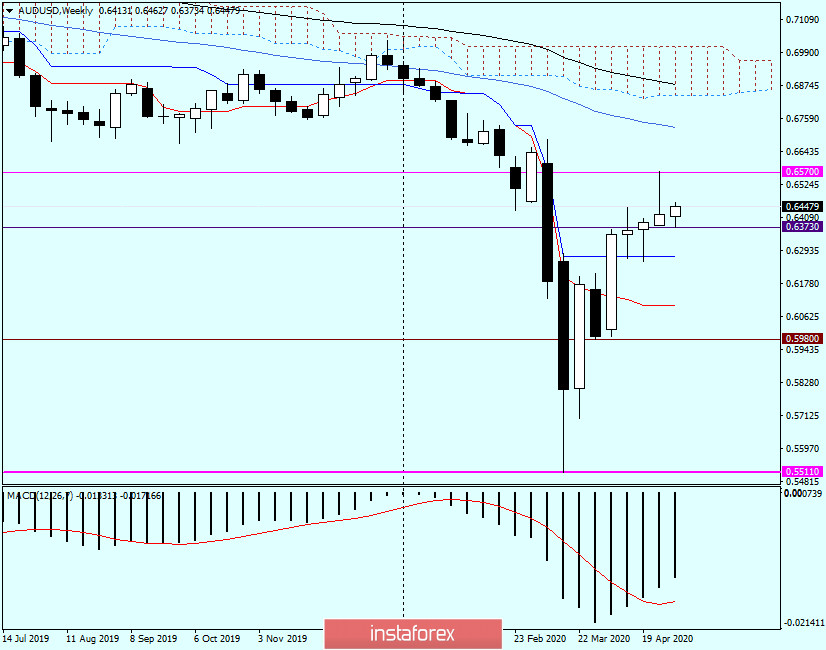
Characteristically, the Aussie has become one of the few major currencies, which, according to the results of the last five-day trading, have strengthened against the US dollar. However, the last candle leaves more questions than answers regarding further price dynamics of the AUD / USD tandem.
As you can see, the candle has a rather long upper shadow, and in its shape, it is very similar to the headstone "Tombstone". And this despite the bullish trend.
Resistance and highs of the previous weekly trading are indicated at 0.6570. Strong enough support is provided by the Kijun line of the Ichimoku indicator, which is located at 0.6270. Thus, the exit from the range 0.6570-0.6270 may indicate the direction of the further price movement of the Aussie.
In the event of a breakdown of the resistance of 0.6570 and the closure of weekly trading higher, the next goal will be 50 simple moving average, which runs at 0.6727. Exit at 0.6270 and the end of the weekly session below this level will indicate the next target in the area of 0.6100, where the Tenkan line is located. Naturally, these are landmarks on the weekly timeframe.
Daily
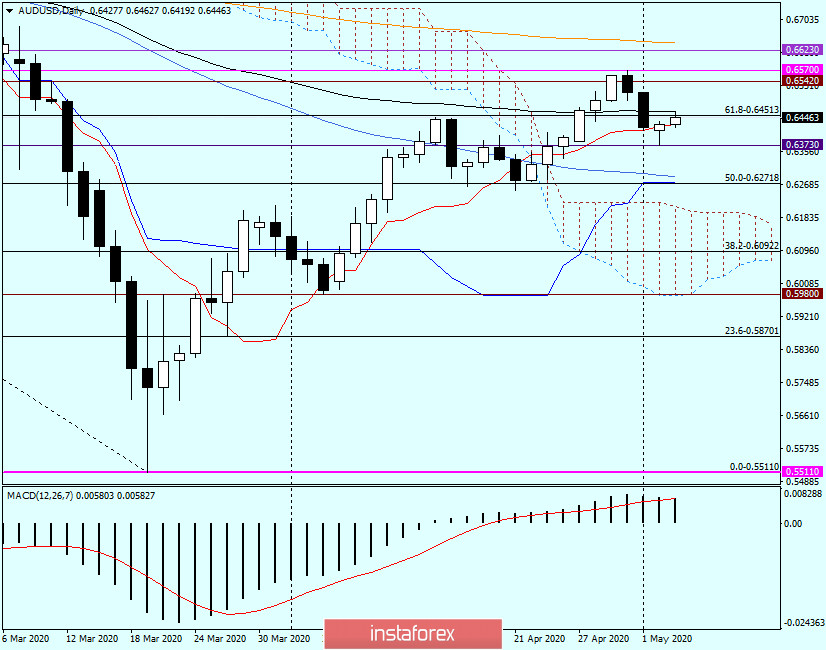
After the decline, which began at 0.6570, the pair traded downwards near 89 exhibitors and the Tenkan lines, which so far are holding back a further decline in quotes. Moreover, yesterday and at the close of this article, the pair is showing moderate strength.
Current resistance is represented by 89 EMA (0.6462), and yesterday's support is the lows shown at 0.6373. It seems that the subsequent direction of the course will depend on the exit from the range 0.6462-0.6373.
It is worth noting that the Australian dollar maintains a positive attitude, which is somewhat surprising in the conditions when investors give preference to safe assets. Nevertheless, judging by the technical picture observed on AUD / USD, I will give my preference to purchases, which I recommend considering after a decrease to 0.6435-0.6425 and 0.6400-0.6370. However, at the time the review is completed, the pair is more prone to decline, as candlestick patterns signal on lower timeframes.
Good luck!


