


TSLA stock price is respecting on a daily basis the major Fibonacci support level at $975. Our first pull back target has been achieved and price has formed twice a bullish hammer candlestick pattern around these levels.
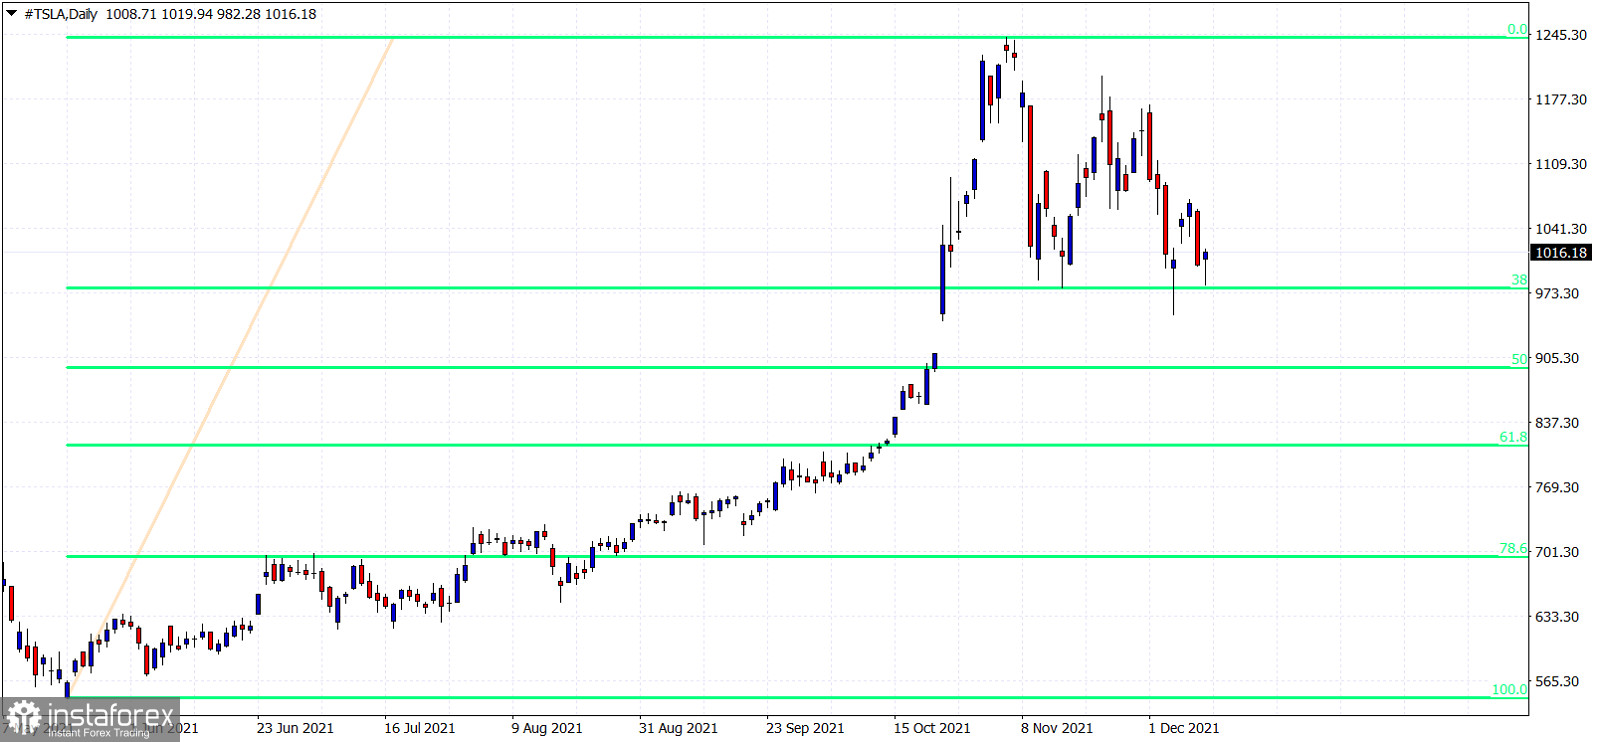
At the beginning of November when price was around $1,170 our analysis warned bulls that price could start a pull back towards the 38% Fibonacci retracement level. Price was expected to find support around $1,000-$970. Price has formed bullish hammer candlesticks twice around this retracement level. The first time price bounced towards $1,070. Then price made a higher low and formed a second hammer on Friday. As long as price is above $948 on a daily basis, bulls have the potential to move higher towards $1,200. Resistance is at $1,070 and breaking above it will increase chances of price pushing to new all time highs.


