At the end of November we posted our technical analysis on the MS stock, saying we expect a major reversal to start specially if price were to break below the support at $95 on a weekly basis. Although on a daily basis price fell as low as $93.86, the weekly close was higher than $95.
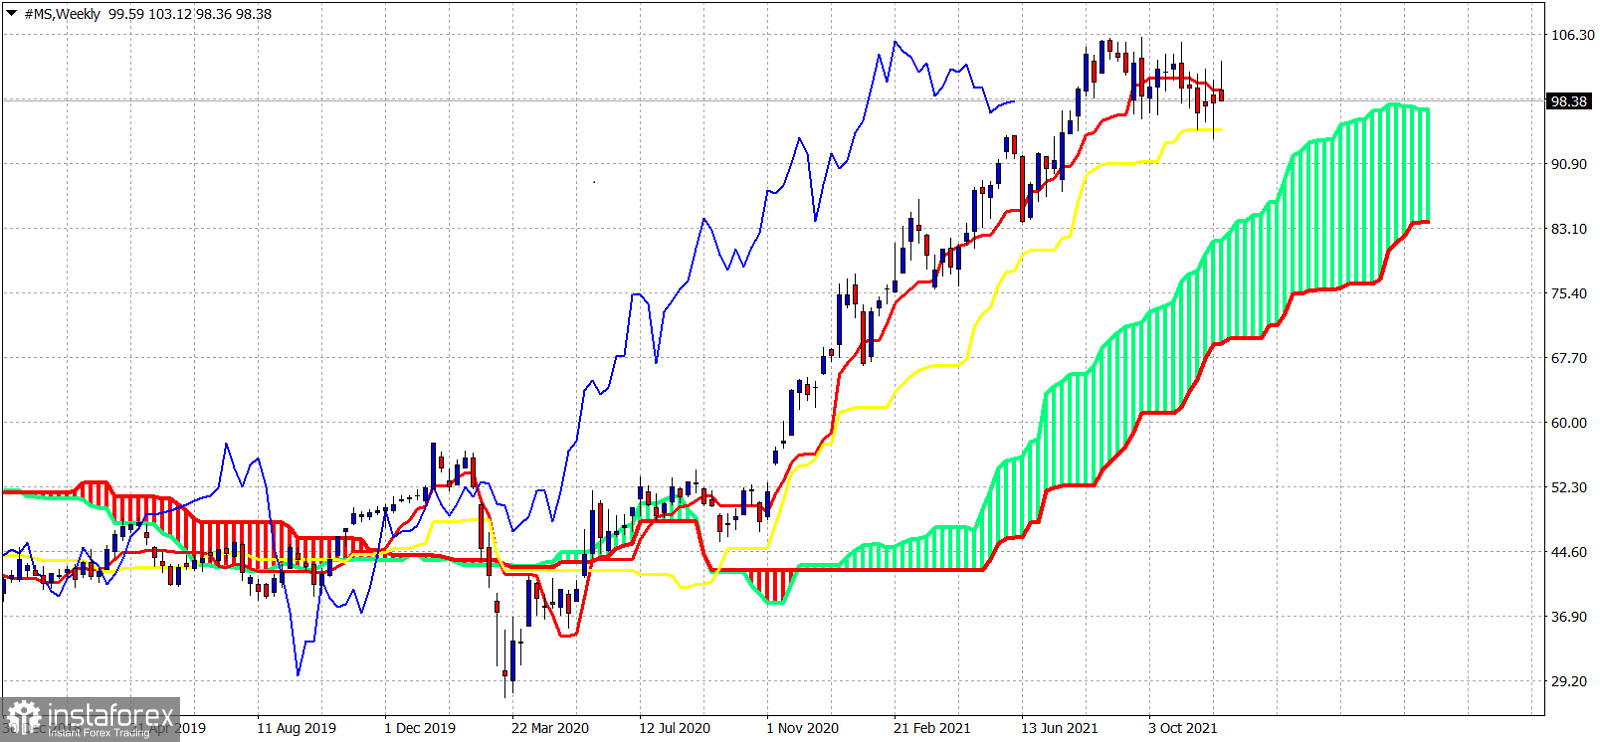
Our view remains the same. We continue to consider MS stock price vulnerable to more downside. Today we use the Ichimoku cloud indicator in order to help us identify some critical price levels to watch out for. Price is above the weeklu Kumo. This means that weekly trend according to the Ichimoku indicator remains bullish. However price has broken below the tenkan-sen (red line indicator) and this is the first sign of weakness. Support by the kijun-sen (yellow line indicator) is at $94.91. A weekly close below this level coincides with our technical analysis conclusion, that a break below $95 would be a confirmation of the start of a reversal. As long as price holds above $94.91 on a weekly basis price could start its next leg higher to new higher highs. Failure to stay above it, will lead price towards the weekly Kumo.


