


Hello!
Last week, the Japanese yen was the only major currency to strengthen against the US dollar. We must admit that this pair goes their way, without looking back at the others. Namely, recently, when all other major currencies are strengthening against the USD, the yen is declining, and vice versa.
In general, there is an interesting situation for this currency pair. Both the Japanese yen and the US dollar are perceived by market participants as safe-haven currencies. However, during the first outbreak of the COVID-19 pandemic, investors gave unconditional priority to the US dollar. Now, when there is a danger of the second wave of a new type of coronavirus infection, market participants seem to prefer the yen as a traditional protective asset.
If you look at the economic calendar, a fairly large flow of macroeconomic data is expected this week, mainly from the US. Among the most important American statistics, it is worth highlighting the final GDP data for the first quarter, which will be published on June 25, at 13:30 (London time). From Japanese statistics this week, we can note the index of business activity in the service sector and the manufacturing sector. Once again, I would like to remind you and draw your attention to the fact that this currency pair, as a rule, reacts strongly to important macroeconomic reports from the US, while Japanese statistics, for the most part, remain unnoticed.
Weekly
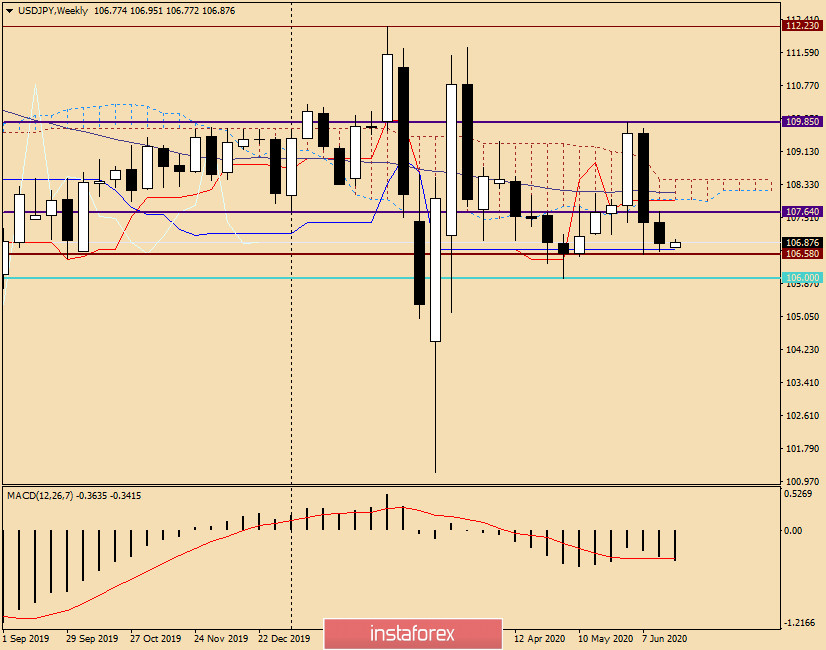
Well, it's time to move on to the charts of the dollar/yen currency pair, and let's start with the results of the past week. So, at the last five-day trading session, the pair continued its downward dynamics, which began after reaching the level of 109.85, that is, just before the meeting with the most important technical and psychological level of 110.00.
The pair settled under the cloud of the Ichimoku indicator, however, the decline was quite restrained, as the Kijun line of this indicator continued to provide strong support and did not let the pair lower. Not yet. All this is visible on the weekly chart. Now about the prospects of price movement for this week. The most relevant, in my personal opinion, is the continuation of the downward scenario. However, to do this, it is necessary to break through the Kijun (106.71), as well as the support level of 106.58. This will be an important task for players to lower the rate, however, the main thing, in my opinion, will be the breakdown of a very important and strong level of 106.00. Only fixing under this mark will finally convince the sellers of the superiority and open the way to lower prices.
To return bullish sentiment for USD/JPY, you need to raise the rate above the previous highs of 107.64, then break through the Tenkan line (107.92), enter the Ichimoku cloud, breakthrough the 50 simple moving average and bring the price up from the cloud. We must admit that the tasks of the warring parties are not easy. You may need a strong driver to solve them.
Daily
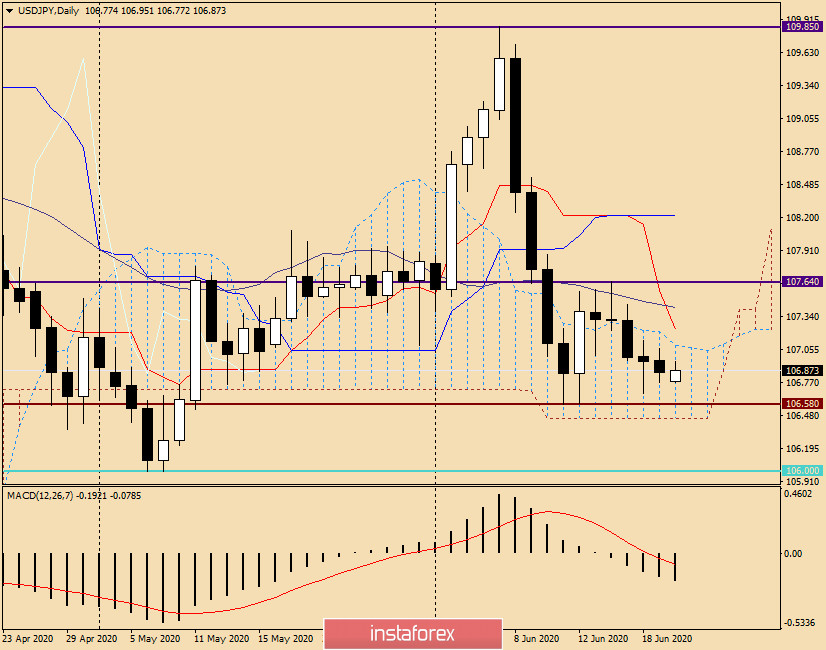
If you go to the daily chart, we see that the quote has already been fixed within the Ichimoku cloud. Now you should wait for the price to go out on one of the sides, which will indicate the further direction of the currency.
I venture to assume that attempts to exit the cloud up will try to contain the Tenkan line, which runs at 107.23, and above 50 MA (107.42). The lower border of the cloud is at 106.45, which is slightly below the strong support level of 106.58.
Conclusion and recommendations for USD/JPY:
Judging by the charts and the increased demand for the Japanese currency, the most relevant scenario is a downward trend. To open short positions on USD/JPY, you should wait for the breakdown of the support of 106.58 and the price to go down from the Ichimoku cloud, after which, on the rollback to the area of 106.45-106.60, consider selling. If this happens, and bearish candlestick signals appear in the selected zone, this will be a confirmation for the pair's sales. Sales at higher prices and also after the appearance of bearish candles are considered from the area of 107.20-107.50. This week, we will return to the consideration of this instrument and, if necessary, make adjustments to the trading plans for USD/JPY.
Good luck!


