


I paid close attention to the 1.0000 level in my morning forecast and suggested making entry decisions there. Let's examine the 5-minute chart to determine what transpired there. Despite a slight downward movement, a continuation of the pair's Asian decline, the price could not reach the 1.0000 level. I did not observe a false breakdown there, which prevented me from entering the market in long positions. Technically, neither the strategy nor the second half of the day have changed.

To initiate long positions on the EURUSD, you must:
Given that there are no more buyers at the current lows, I anticipate that pressure on the European currency will increase during the American session, especially given the release of US producer price index data. And despite forecasts of a slight slowdown in June compared to May, it is unlikely that this will benefit the euro significantly. As stated previously, the technical situation has not changed. In the event of a sharp decline in the pair against the backdrop of the US inflation report, buyers will need to defend the nearest support level of $ 1.0001. Only after the formation of a false breakdown can an upward correction be anticipated. An equally important objective remains the resistance level at 1.0057, where the moving averages favor sellers. A breakout and a top-to-bottom test of this range will trigger stop orders, signaling the entry into long positions with the potential for a larger increase to 1.0116. However, it will not be possible to discuss the continuation of the upward correction until the American reports have been released. Bears will attempt to construct the upper boundary of the descending channel at 1.0116, so growth will be clearly constrained. A more distant objective will be the area around 1.0182, where I recommend locking in profits. With the possibility of a decline in the EUR/USD exchange rate and the absence of buyers at 1.0001 in the afternoon, which is more likely, the pressure on the euro will intensify significantly once more. In this case, I would advise against rushing into the market: the best opportunity for opening long positions will be a false breakdown in the 0.9958 area. I recommend buying EUR/USD immediately for a rebound only from the 0.9915 level, or even lower – around 0.9886, with the goal of a 30-point-per-day upward correction.
To establish short positions on the EURUSD, you must:
As long as trading remains below 1.0057, everyone will anticipate a further decline in the euro versus the US dollar, particularly in light of yesterday's report. In the case of EUR/USD growth in the afternoon, the next formation of a false breakdown, along with strong data on the growth rate of inflation in the United States, constitutes a signal to open short positions with the expectation of a further decline in EUR/USD and a return to support 1.0001. It is the last "stop" before the euro/dollar parity break. A breakdown and consolidation below this range, as well as a reverse test from the bottom up, will generate an additional sell signal with the destruction of buyers' stop orders and a larger decline to the 0.9958 region. Fixing below is a direct path to 0.9915, where I recommend exiting sales completely. The 0.9886 area represents a more distant target. If EUR/USD moves higher during the American session and there are no bears at 1.0057, you should postpone short positions until 1.0116's resistance becomes more attractive. However, only the formation of a false breakdown at 1.0116 will signal the continuation of the bear market, as traders' reactions to the US data are still unknown. On a rebound from the maximum of 1.0182, or even higher – around 1.0271, EUR/USD can be sold with the objective of a 30-35-point decline.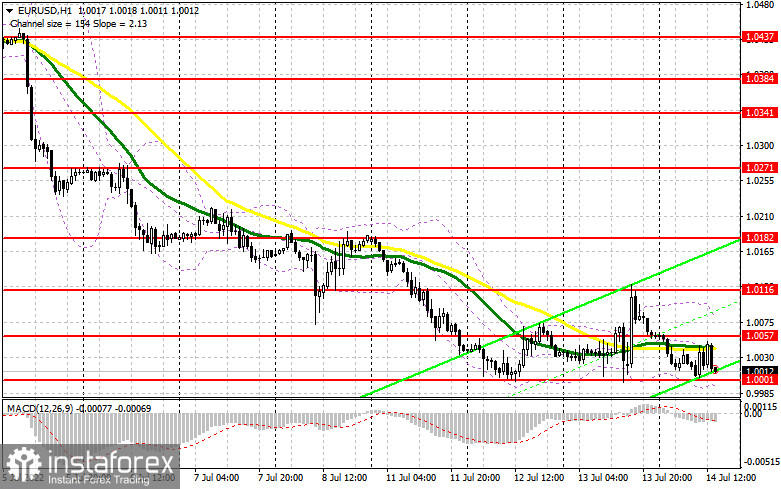
The COT report (Commitment of Traders) for the 5th of July revealed an increase in both long and short positions, but the increase in short positions was near twice as large, indicating the market's persistent bearish sentiment. This resulted in the expansion of the negative delta. Retail sales in the eurozone were disappointing last week. In contrast, data on the US labor market indicated that the Federal Reserve System must continue to pursue a hyperaggressive monetary policy if it is to combat high inflation. Christine Lagarde, president of the European Central Bank, also spoke, emphasizing the need to raise interest rates for the same reason. In the near future, a significant report on inflation in the United States is anticipated, which may signal another surge in price growth. If this occurs, you will not be surprised by the dollar's continued appreciation against the euro and its eventual parity with this instrument. According to the COT report, long non-commercial positions increased by 7,724 to 197,138, while short non-commercial positions increased by 13,980 to 213,990. Despite the low exchange rate of the euro, the need for additional aggressive central bank policy, and the recession in many developed countries, dollar purchases continue to be encouraged. The total non-commercial net position at the end of the week remained negative at -16,852 versus -10,596. The weekly closing price decreased from 1.0584 to 1.0316.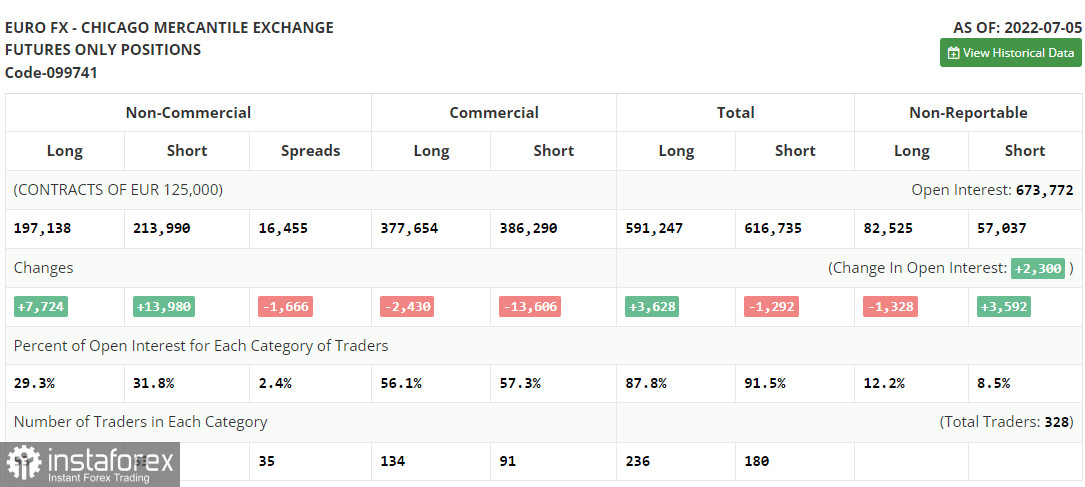
Signals of indicators:
Moving Averages
The euro is trading below its 30 and 50-day moving averages, indicating that a further decline is likely.
The author considers the period and prices of moving averages on the hourly chart H1, which differs from the classic definition of daily moving averages on the daily chart D1.
Bollinger Bands
The indicator's upper limit near 1.0090 will act as resistance in an upward trend. A breach of the lower limit in the region of 1.0000 will result in a fresh euro sell-off.
Description of indicators- Moving average (moving average determines the current trend by smoothing out volatility and noise). Period 50. The graph is marked in yellow.
- Moving average (moving average determines the current trend by smoothing out volatility and noise). Period 30. The graph is marked in green.
- MACD indicator (Moving Average Convergence / Divergence - moving average convergence/divergence) Fast EMA period 12. Slow EMA period 26. SMA period 9
- Bollinger Bands (Bollinger Bands). Period 20
- Non-profit speculative traders, such as individual traders, hedge funds, and large institutions use the futures market for speculative purposes and to meet certain requirements.
- Long non-commercial positions represent the total long open position of non-commercial traders.
- Short non-commercial positions represent the total short open position of non-commercial traders.
- Total non-commercial net position is the difference between the short and long positions of non-commercial traders.


