


In my morning review, I pointed out the level of 1.1831 and recommended using it as an entry point. Let's have a look at the 5-minute chart and find out how the situation has changed there. A decline in the pound and a false breakout of the 1.1831 level formed a nice entry point for going long on the pair. I mentioned this scenario in my outlook for the European session. As a result, the pair advanced by 40 pips. However, it failed to reach the key resistance of 1.1887 which could have been used as a good point for opening short positions. The technical picture has slightly changed in the afternoon as the pair has tested the level of 1.1831.
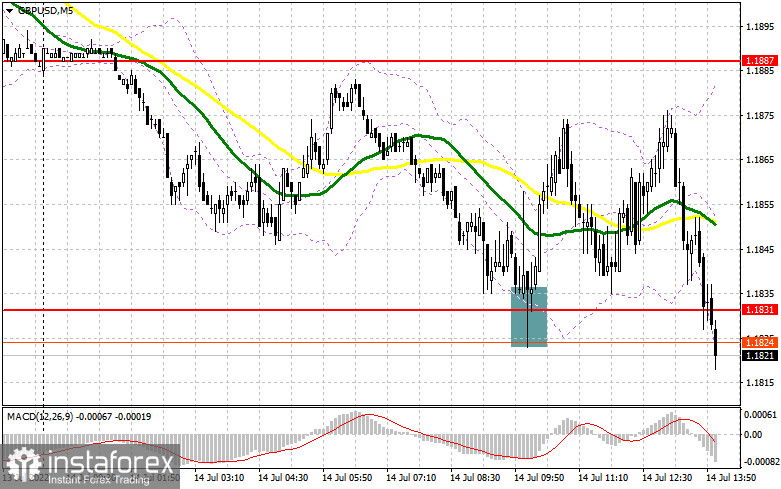
For long positions on GBP/USD
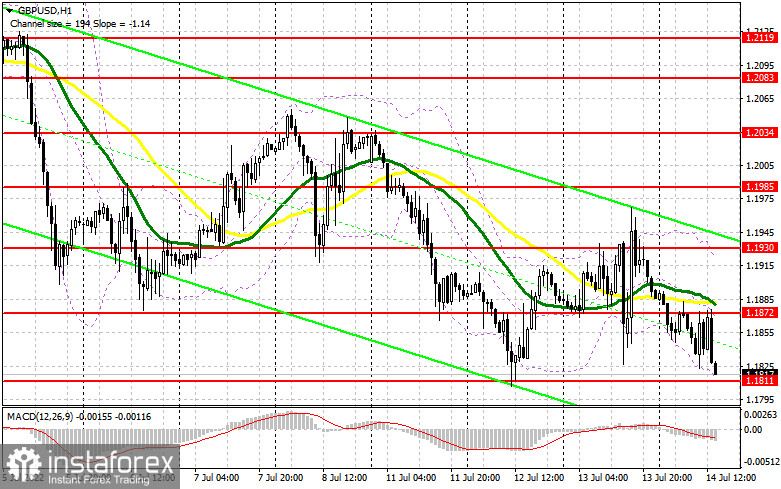
During the North American session, investors expect the publication of the US Producer Price Index for June. The data may indirectly influence the further policy of the US Federal Reserve and the trajectory of GBP/USD. A strong report will increase the pressure on risk assets, including the British pound, which will accelerate the decline of the pair. If GBP/USD falls in the second part of the day, bulls may assert their strength near the support level of 1.1811 which also serves as a yearly low. A false breakout of this level will be a good signal to open long positions, considering an upside correction to the nearest resistance of 1.1872. Moving averages that currently support the bearish trend are passing above this level. A breakout of 1.1872 will prompt a stronger upside movement. A test of this level from top to bottom will generate a buy signal for a more rapid jump towards 1.1930. A similar breakout of this level will be possible only if the US inflation data shows that consumer prices have slowed down. This, in turn, will ease the pressure on the Fed. Moreover, this will pave the way towards the area of 1.1985 where I recommend taking profit. The level of 1.2034 will serve as a more distant target, and a test of this level will indicate the formation of a new upward cycle. In case of a drop and low bullish activity at the level of 1.1811, the pound/dollar pair will depreciate further. If so, I would advise you to open long positions only after the price reaches 1.1742. It is better to buy the pair only after a false breakout of this level. It is possible to go long on GBP/USD right after a rebound from 1.1647, or even lower from 1.1575, keeping in mind a possible correction of 30-35 pips within the day.
For short positions on GBP/USD
Bears have already broken below the morning support of 1.1831 and are now heading towards this year's low of 1.1811. This is the last foothold for the pair that prevents it from a massive sell-off. Notably, the sellers have already retested yesterday's low, which goes in line with the downtrend. Yet, to gain full control of the market, bears need to break below 1.1811 as soon as possible. This can be achieved only on strong macroeconomic data from the US. A breakout and consolidation below 1.1811, as well as a retest of this range, will trigger stop-loss orders placed by the bulls. This will also create an additional entry point to sell the pound with the downward target at 1.1742. I recommend locking in some profit at this level. The level of 1.1647 is seen as the next downward target. If GBP/USD goes up, I recommend waiting for a false breakout at 1.1872 to open short positions there. If bears are weak at this level, bulls may take advantage of this. In this case, I would advise you to sell the pair only when the price reaches the level of 1.1930, considering a downside pullback. If nothing happens there as well, the price may rush to the upside amid canceled stop-loss orders placed by speculative sellers. In this case, it is better to go short when the quote hits 1.1985. At this point, you can sell GBP/USD right after a rebound, keeping in mind a downside pullback of 30-35 pips within the day.
COT report
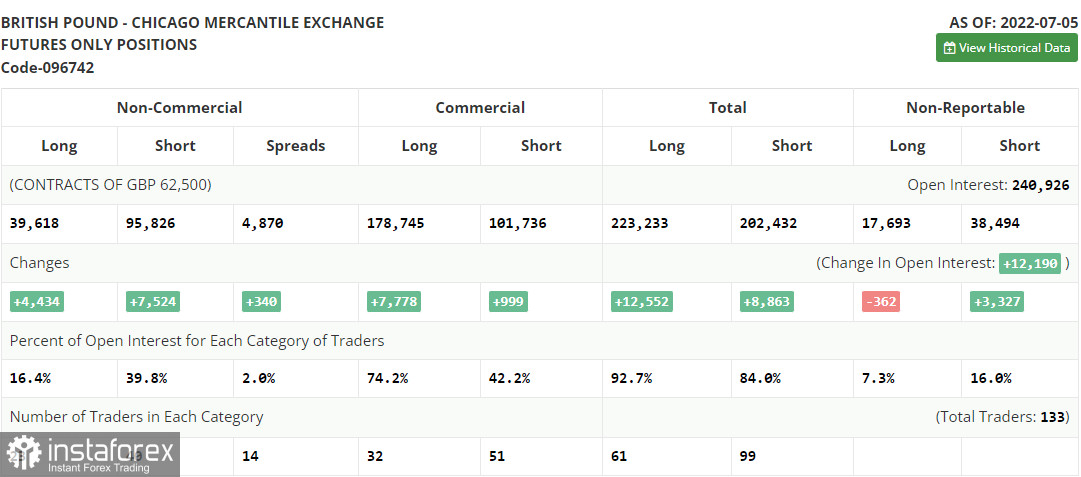
The COT (Commitment of Traders) report for July 5 showed a rise in both short and long positions. However, short positions prevailed which led to an increase in the negative delta. Another attempt to buy the pair near yearly lows failed after it became clear that the Bank of England will keep raising the rate to tackle inflation. This policy will further slow down the UK economy and will push it closer to a recession. The cost of living crisis is getting more acute every day, and the recent resignation of UK Prime Minister Boris Johnson is likely to make things worse. There is currently no reason to buy the pound apart from the fact that it has recently retested yearly lows. The Fed's policy and the pace of monetary tightening in the US provide significant support to the US dollar. Besides, the economic situation in the US is slightly better than in the UK, which is confirmed by the fresh employment data for June. According to the COT report, long positions of the non-commercial group of traders increased by 4,434 to 39,618, while short positions surged by 7,524 to 95,826. As a result, the negative non-commercial net position increased to -56,208 from -53.118. The weekly closing price declined to 1.1965 versus 1.2201.
Indicator signals:
Moving Averages
Trading below the 30 and 50-day moving averages indicates the further fall of the pair.
Please note that the time period and levels of the moving averages are analyzed only for the H1 chart, which differs from the general definition of the classic daily moving averages on the D1 chart.
Bollinger Bands
In case of an uptrend, the upper band of the indicator at 1.1930 will serve as resistance. A breakout of the 1.1810 level will put more pressure on the pair.
Description of indicators:
• A moving average of a 50-day period determines the current trend by smoothing volatility and noise; marked in yellow on the chart;• A moving average of a 30-day period determines the current trend by smoothing volatility and noise; marked in green on the chart;• MACD Indicator (Moving Average Convergence/Divergence) Fast EMA with a 12-day period; Slow EMA with a 26-day period. SMA with a 9-day period;• Bollinger Bands: 20-day period;• Non-commercial traders are speculators such as individual traders, hedge funds, and large institutions who use the futures market for speculative purposes and meet certain requirements;• Long non-commercial positions represent the total number of long positions opened by non-commercial traders;• Short non-commercial positions represent the total number of short positions opened by non-commercial traders;• The total non-commercial net position is the difference between short and long positions of non-commercial traders.


