


Early in the American session, GBP/USD is trading around 1.2438. We can see on the 1-hour chart that the British pound is consolidating above the 200 EMA which could be seen as a bullish sign for the pair. In the next few hours, we could expect a technical correction towards the 23.6% Fibonacci or towards the 21 SMA located at 1.2387.
In case of a technical correction, it could be used as an opportunity to continue buying as the eagle indicator reached the oversold zone on April 17 and it is likely that the British pound could continue to rise in the coming days.
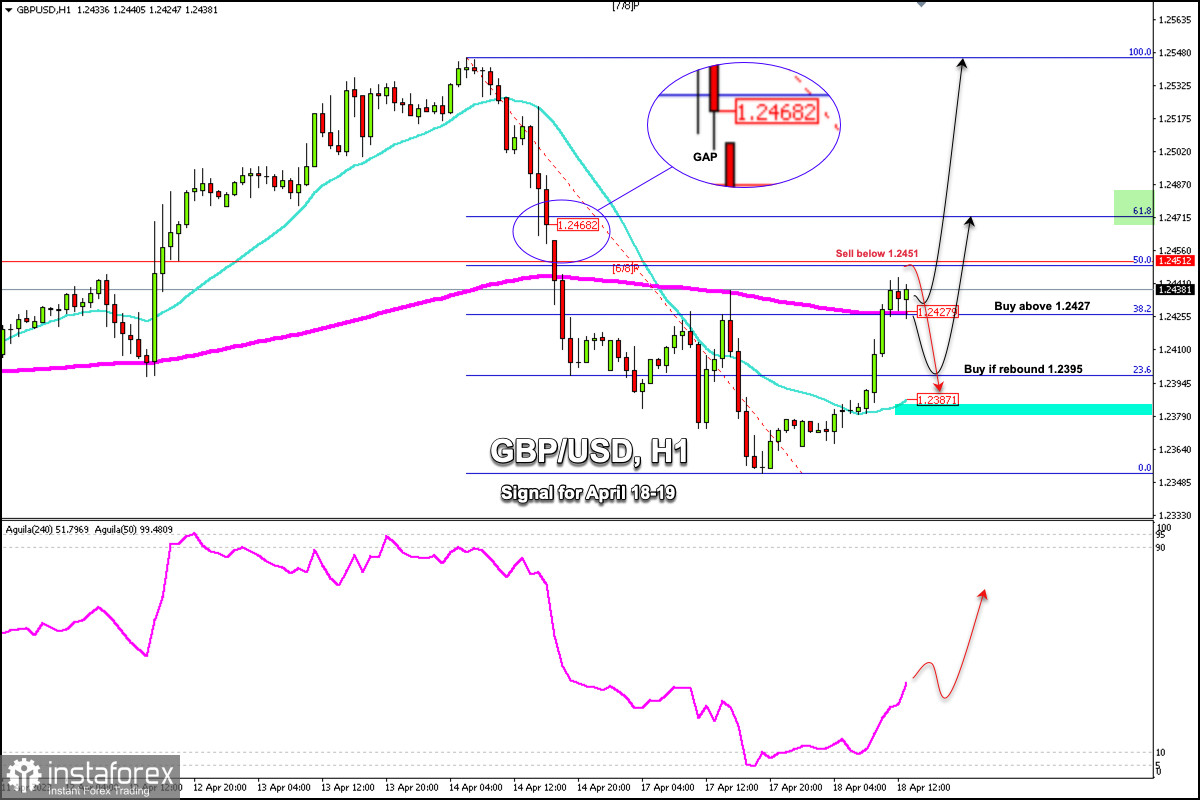
On the chart, we can see that the pound has left a gap around 1.2468. This level coincides with the 61.8% Fibonacci retracement. Investors are likely to take profit in this zone. If GBP/USD fails to break it, we could expect a reversal of the trend and a deeper decline.
The GBP/SUD pair reached a low of 1.2353 yesterday and has since recovered to the 50% Fibonacci retracement. The technical outlook does not show a convincing short-term move higher. This technical correction could be seen as an entry for the bears. The key will be waiting for consolidation above 1.2470 (200 EMA).
We expect a technical correction in GBP/USD in the next few hours or we could expect it to reach 6/8 Murray and be rejected to sell with targets at 1.2395. On the other hand, a technical bounce around the 21 SMA will be seen as a signal to buy with targets at 1.2450 (6/8), 1.2470 (61.8%), and 1.2545 (13 Apr high).


