


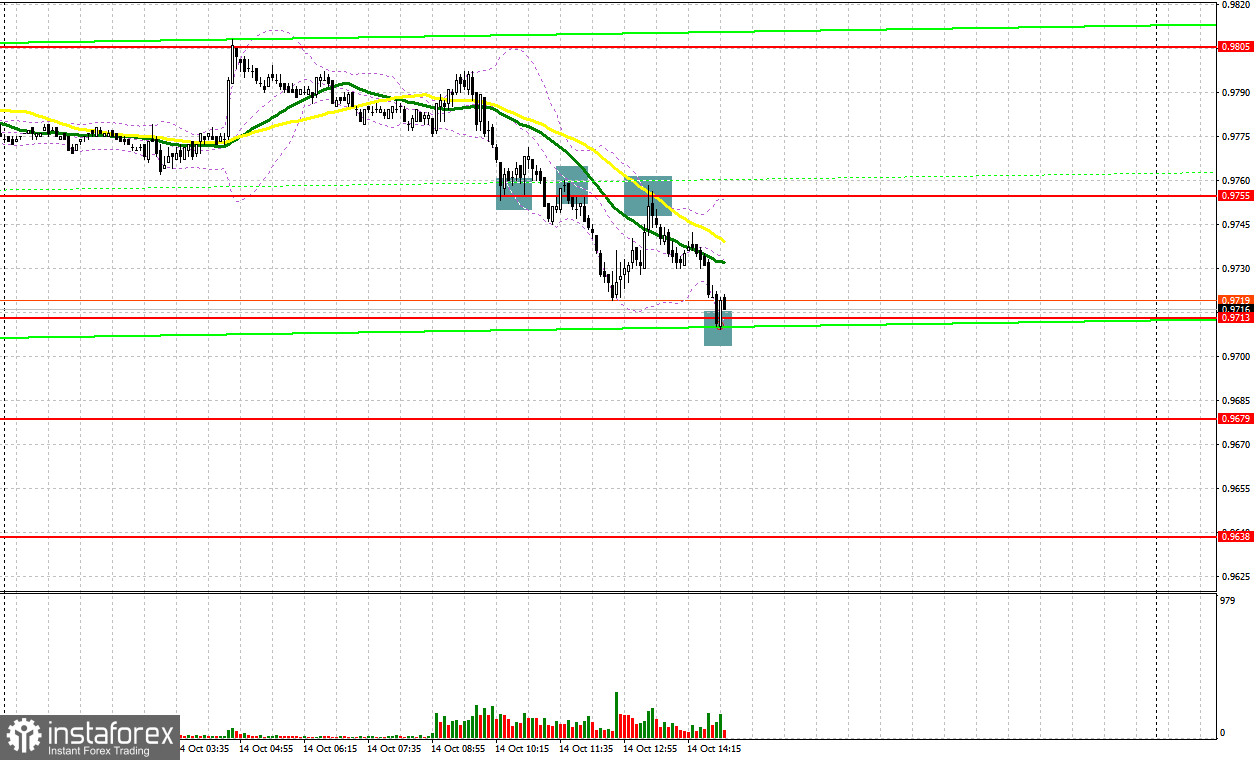
In my morning forecast, I paid attention to the 0.9755 level and recommended deciding on entering the market there. Let's look at the 5-minute chart and figure out what happened there. The importance of this area was very clear: the bulls even tried to offer something on the false breakout that formed in the first half of the day at this level, but the upward movement did not occur. A small leap of 15 points, and that's it. On the second attempt, the bears broke below 0.9755, and the reverse test gave a signal to sell the euro, resulting in a 35-point drop. But even if you didn't manage to enter the market on the first attempt, a repeated update of 0.9755 and a false breakdown at this level led to another entry point into short positions, resulting in a decline of more than 40 points.
To open long positions on EURUSD, you need:
The entire focus is now on the report on retail sales in the US, and it will "rule the ball" during the American session. Suppose the final data turns out to be higher than economists' forecasts. In that case, demand for the US dollar will increase, which will only put more pressure on the euro, which is experiencing problems after yesterday's attempt to interrupt the bear market. If the data shows a reduction in retail sales, it signals to buy the euro as the probability of a more active slowdown in inflation will increase. In this case, we can count on a breakthrough of 0.9755 and an upward movement, which, in the foreseeable future, will have to return EUR/USD to the parity area. The optimal scenario for buying in the event of a decline in the pair is the formation of a false breakdown in the area of 0.9713, by analogy with the one formed in the first half of the day. This will lead to growth with the aim of re-moving to the area of 0.9755, where the moving averages are playing on the sellers' side. A buy signal and a top-down test will negate all the efforts of the bears to control the market, which will lead to a buy signal and a recovery to the area of the weekly maximum of 0.9805. A breakthrough in this area will also open a direct road to 0.9841, which will seriously harm sellers' plans to maintain control over the market. With the option of a further decline in EUR/USD after the US data, a break of 0.9713 will quickly push the euro down to the next support of 0.9679. From this level, I recommend also buying only on a false breakdown. I advise you to open long positions on EUR/USD immediately for a rebound only from the minimum of 0.9638, or even lower – around 0.9540, with the aim of an upward correction of 30–35 points within a day.
To open short positions on EURUSD, you need:
Sellers coped with the morning tasks and returned to the market under their control and control over the 0.9755 level. This area is now so important to protect in the afternoon. Only a false breakdown there will lead to a new sell signal with the prospect of a repeat test of 0.9713. A breakthrough and consolidation below this range will occur only in the case of strong retail sales statistics in the US, which will create additional pressure on the euro. A reverse test from the bottom up of this range will give a sell signal with the demolition of buyers' stop orders and the prospect of updating the 0.9679 minimum. A more distant goal will be the support of 0.9638, where I recommend fixing profits. In the event of an upward movement of EUR/USD during the US session, as well as the absence of bears at 0.9755, buyers will gain an advantage, which will again lead to a correction of the euro to the maximum of 0.9805. There I advise you to sell also only on a false breakdown. It is possible to open short positions immediately for a rebound only from 0.9841 or even higher – from 0.9878 with the aim of a downward correction of 30–35 points.
Signals of indicators:
Moving Averages
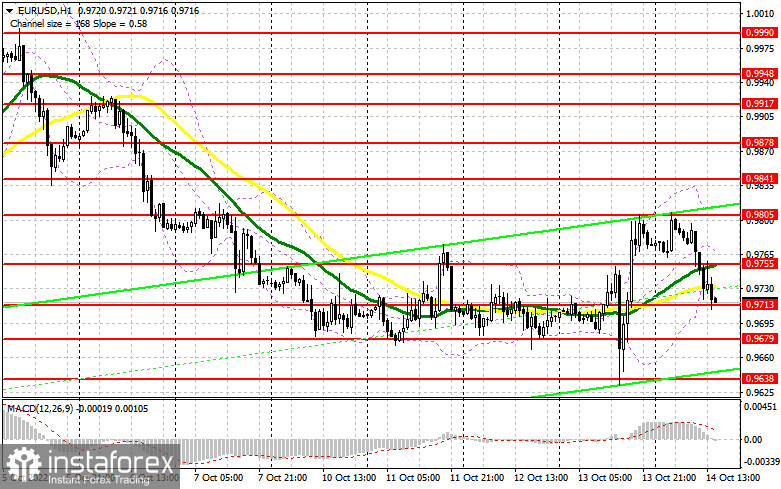
Trading is conducted around the 30 and 50-day moving averages, which indicates market uncertainty.
Note: The author considers the period and prices of moving averages on the hourly chart H1 and differ from the general definition of the classic daily moving averages on the daily chart D1.
Bollinger Bands
In the case of growth, the upper limit of the indicator in the area of 0.9805 will act as resistance.
Description of indicators
- Moving average (moving average determines the current trend by smoothing out volatility and noise). Period 50. The graph is marked in yellow.
- Moving average (moving average determines the current trend by smoothing out volatility and noise). Period 30. The graph is marked in green.
- MACD indicator (Moving Average Convergence / Divergence - moving average convergence/divergence) Fast EMA period 12. Slow EMA period 26. SMA period 9
- Bollinger Bands (Bollinger Bands). Period 20
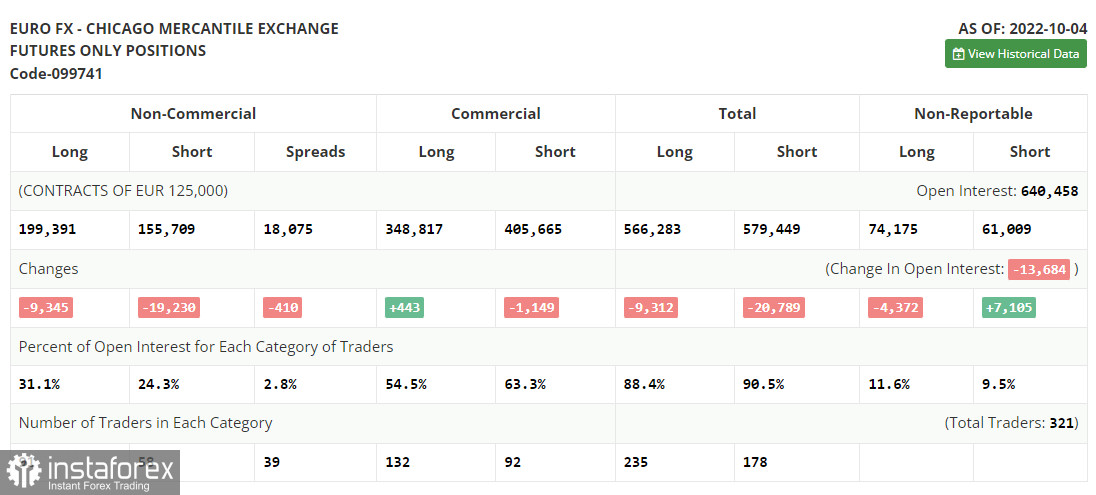
- Non-profit speculative traders, such as individual traders, hedge funds, and large institutions, use the futures market for speculative purposes and to meet certain requirements.
- Long non-commercial positions represent the total long open position of non-commercial traders.
- Short non-commercial positions represent the total short open position of non-commercial traders.
- Total non-commercial net position is the difference between the short and long positions of non-commercial traders.


