


Long positions on GBP/USD:
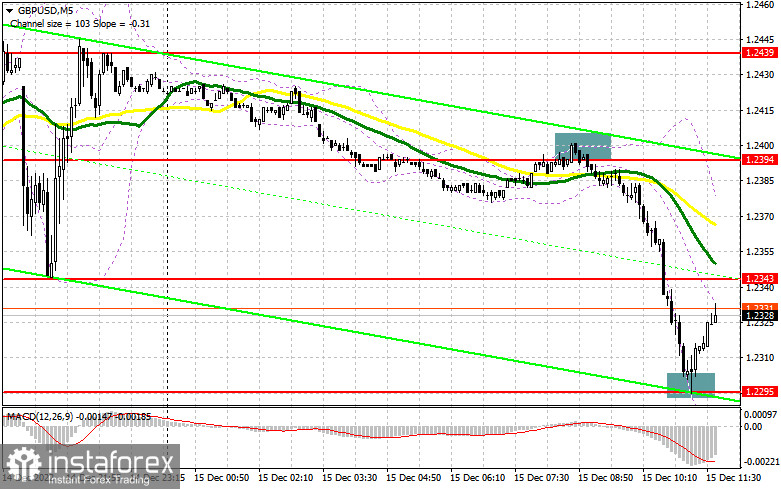
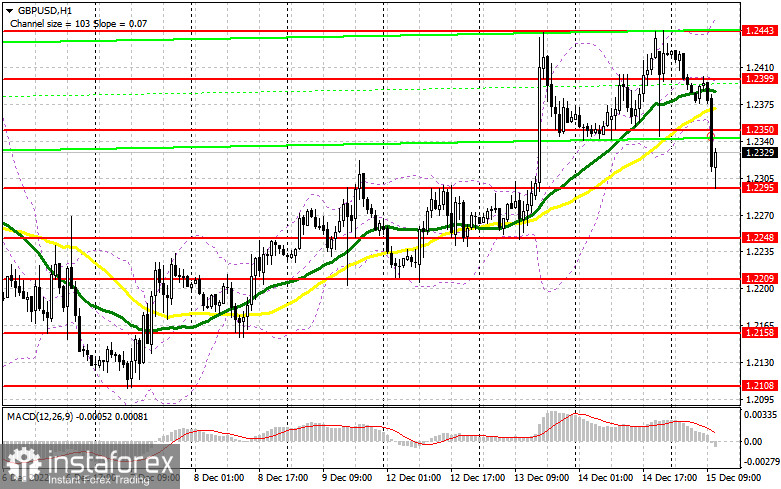
Everything is likely to depend on the decision of the Bank of England and the US retail sales data. The Bank of England is expected to increase the key rate by 0.5%, as well as announce a slower pace of rate hikes to fight inflation. At the same time, the US retail sales data may surprise the markets. The unexpected rise could trigger a larger downward movement of the British pound, leading to a reversal of December's bullish trend. For this reason, the best scenario to buy GBP/USD in the current conditions would be the formation of a false breakout near the support of 1.2295. However, as it has already been pierced once, it is not worth relying on it. Bulls may count on an upward rally to 1.2350. They will need to fix the price above this level. A top-down test of this range, against the background of weak US data, is likely to give an entry point to continue the bullish trend toward 1.2399. If the price breaks through this level, bulls may receive strong support, creating a signal for entry into long positions and reaching a new high of 1.2443. The next target is located at 1.2484, where traders may take profits. If bulls fail to follow the above-mentioned scenario in the second half of the day and let the price drop below 1.2295, the pressure on the pair may increase at the end of the week. In this case, it would be better to buy GBP from 1.2248 after a false breakout. One may open long positions on a rebound from 1.2209 or lower near 1.2158, allowing an intraday correction of 30-35 pips.
Short positions on GBP/USD:
It seems that bears are refraining from opening new positions before the release of the statistics, which is confirmed by the pair's sharp surge from 1.2295. They need to defend the new resistance of 1.2350, where the false breakout may give a signal to enter into short positions, counting on a return to 1.2295. If the price break through this level after the Bank of England announcement, it may create an additional sell signal after a downward test, counting on a downtrend to 1.2248. However, bears are likely to face some difficulties there. A breakthrough and a downward test of this level may open the way to the area of 1.2209, where traders may gain profits. If the price fails to move lower from 1.2350, bulls may try to regain control over the market and pierce 1.2399, where the moving averages are located. Notably, the MAs are supporting bears now. A false breakout at this level would give an entry point into short positions. If we see no activity near this level, one may sell GBP on a pullback from 1.2443, allowing an intraday correction of 30-35 pips.
COT report
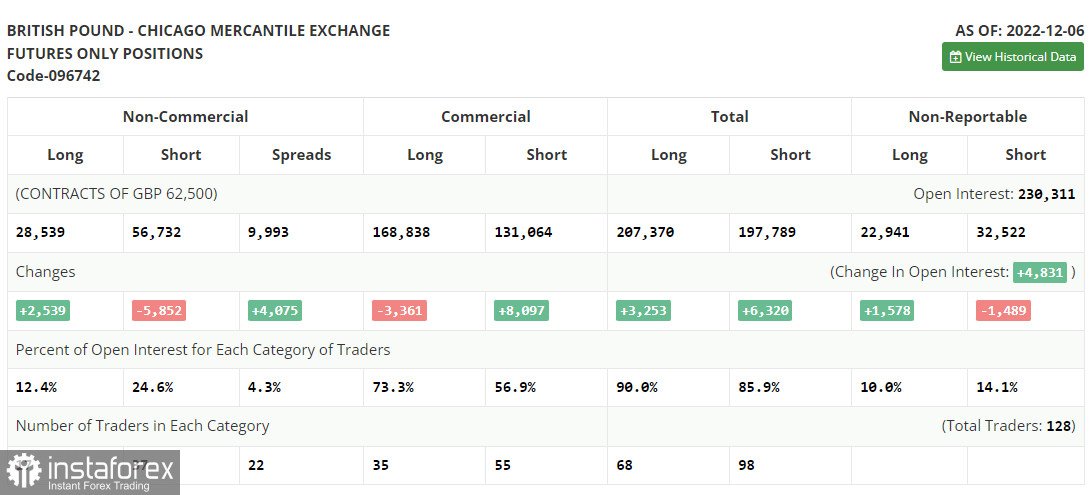
The Commitments of Traders report for December 6 showed a rise in long positions and a drop in the short ones. Apparently, bulls expect it to rise further given that the monetary policy of the US Fed is getting less aggressive. Besides, the Bank of England has managed to catch up with the interest rate set by the Fed. At the same time, the recent data on business activity in the UK signals that the country has entered a recession although its scope is smaller than economists had predicted. The fresh GDP report has exceeded expectations. However, it had been contracting for the three previous months which is another proof that the recession is here. The Bank of England is determined to tackle inflation further and raise borrowing costs which means that the UK economy has more hurdles ahead. Therefore, it is hardly surprising that traders do not rush to buy the pair although they still do so in the short-term perspective. According to the latest COT report, short positions of the non-commercial group of traders declined by 5,852 to 56,732, while long positions went up by 2,539 to 28,539. This led to a decrease in the negative value of the total non-commercial net position to -28,193 from -36 584. The weekly closing price increased to 1.2149 from 1.1958 a week ago.
Indicator signals:
Moving Averages
Trading below the 30- and 50-day moving averages indicates that the market is reversing.
Please note that the time period and levels of the moving averages are analyzed only for the H1 chart, which differs from the general definition of the classic daily moving averages on the D1 chart.
Bollinger Bands
In case of growth, the upper band of the indicator at 1.2443 will offer resistance.
Description of indicators:
- A moving average of a 50-day period determines the current trend by smoothing volatility and noise; marked in yellow on the chart;
- A moving average of a 30-day period determines the current trend by smoothing volatility and noise; marked in green on the chart;
- MACD Indicator (Moving Average Convergence/Divergence) Fast EMA with a 12-day period; Slow EMA with a 26-day period. SMA with a 9-day period;
- Bollinger Bands: 20-day period;
- Non-commercial traders are speculators such as individual traders, hedge funds, and large institutions who use the futures market for speculative purposes and meet certain requirements;
- Long non-commercial positions represent the total number of long positions opened by non-commercial traders;
- Short non-commercial positions represent the total number of short positions opened by non-commercial traders;
- The non-commercial net position is the difference between short and long positions of non-commercial traders


