


The EU PMI Indices published in the morning turned out to be mixed. However, the economic situation is rather grim as there are many signs of a looming recession.
When to open long positions on EUR/USD:
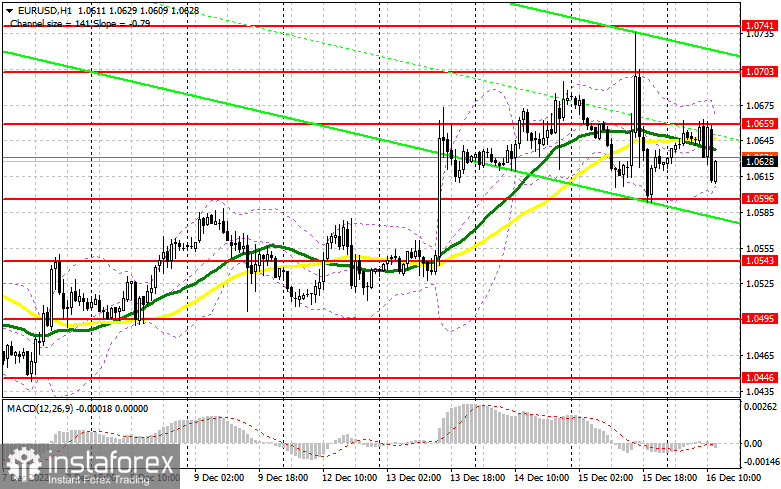
In the afternoon, the US Manufacturing and Services PMI Indices are on tap. The US will also unveil the Composite PMI Index. Analysts expect the figures to be weak, which could help the euro return to the middle of the sideways channel. If the readings top market expectations, which is also likely, the EUR/USD pair may slide to1.0596, the lower border of the sideways channel. Only a false breakout of this level will give a bug signal, pushing the price to 1.0654. At this level, the moving averages are passing in the bearish territory. This is the pivot level for the pair as a breakout below or about it will determine the further trajectory of the pair. A breakout and a downward retest of the level after the release of the economic reports will help bulls cement the uptrend. The pair is likely to climb to 1.0703. However, it will be extremely difficult for the pair to advance above this level. Yet, everything is possible. After a breakout of 1.0793, the pair could reach a more distant target level of 1.0741 where I recommend locking in profits. If EUR/USD declines during the US session and bulls show no activity at 1.0596, the pressure on the euro will escalate. Bulls who have been counting on a further rise will have to close Stop Loss orders. In this case, only a false breakout of the support level of 1.0543 will generate a buy signal. You could open long positions on EUR/USD immediately at a bounce from 1.0495 or lower from 1.0446, keeping in mind an upward intraday correction of 30-35 pips.
When to open short positions on EUR/USD:
Sellers managed to defend the middle of the sideways channel. There could be a surge in volatility after the release of US macro stats. There are no other events that bears could use to push the pair lower. If the euro climbs amid weak PMI figures, only a false breakout of the resistance level of 1.0654 will provide a sell signal with the prospect of a decline to the support level of 1.0596. A breakout below this level amid better-than-expected US data and an upward retest will give an additional buy signal. Bulls will be forced to close their Stop Loss orders. The pair will sink to 1.0543, which will significantly undermine the bullish trend. A more distant target will be the 1.0495 level where buyers could assert strength and try to buy at the lows. If EUR/USD moves up during the US session and bears show no energy at 1.0654, sellers may lose momentum. Buyers will get a good chance to push the quotes to a high of 1.0703. I would recommend you open short positions at this level only if a false breakout takes place. You could sell EUR/USD can be immediately at a bounce from a high of 1.0741, keeping in mind a downward intraday correction of 30-35 pips.
COT report
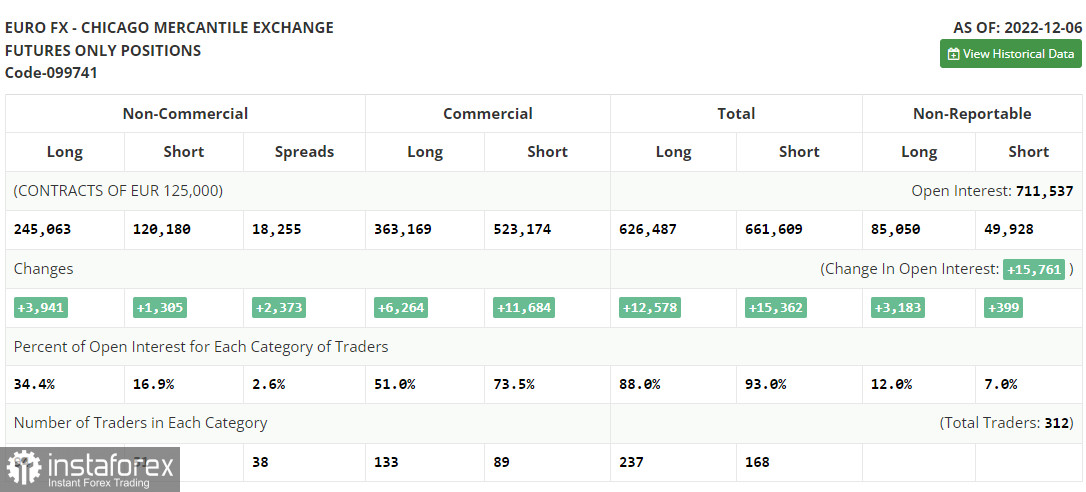
According to the COT report from December 6, the number of both long and short positions increased. Strong business activity data from the US slightly overshadowed the eurozone GDP report for the third quarter, which was upwardly revised. Thanks to this demand for risk assets remained intact. However, the situation may alter this week because of the publication of the US inflation figures. Notably, the US inflation may rise against the forecast. In this case, the market situation will change again. Later, the Fed will hold a meeting. Jerome Powell may switch to a more hawkish stance, thus supporting the greenback. If inflation continues falling, the euro may show a jump by the end of the year. The COT report unveiled that the number of long non-commercial positions increased by 3,941 to 245,063, while the number of short non-commercial positions rose by 1,305 to 120,180. At the end of the week, the total non-commercial net position increased slightly to 123,113 against 122,234. This indicates that investors are still optimistic and are ready to continue buying the euro at current levels. They just need a new fundamental reason. The weekly closing price decreased to 1.0315 from 1.0342.
Indicators' signals:
Trading is carried out below the 30 and 50 daily moving averages. It indicates a downward correction.
Moving averages
Note: The period and prices of moving averages are considered by the author on the H1 (1-hour) chart and differ from the general definition of the classic daily moving averages on the daily D1 chart.
Bollinger Bands
If EUR/USD moves up, the indicator's upper border at 1.0691 will serve as resistance.
Description of indicators
- Moving average (moving average, determines the current trend by smoothing out volatility and noise). Period 50. It is marked yellow on the chart.
- Moving average (moving average, determines the current trend by smoothing out volatility and noise). Period 30. It is marked green on the chart.
- MACD indicator (Moving Average Convergence/Divergence - convergence/divergence of moving averages) Quick EMA period 12. Slow EMA period to 26. SMA period 9
- Bollinger Bands (Bollinger Bands). Period 20
- Non-commercial speculative traders, such as individual traders, hedge funds, and large institutions that use the futures market for speculative purposes and meet certain requirements.
- Long non-commercial positions represent the total long open position of non-commercial traders.
- Short non-commercial positions represent the total short open position of non-commercial traders.
- Total non-commercial net position is the difference between the short and long positions of non-commercial traders.


