


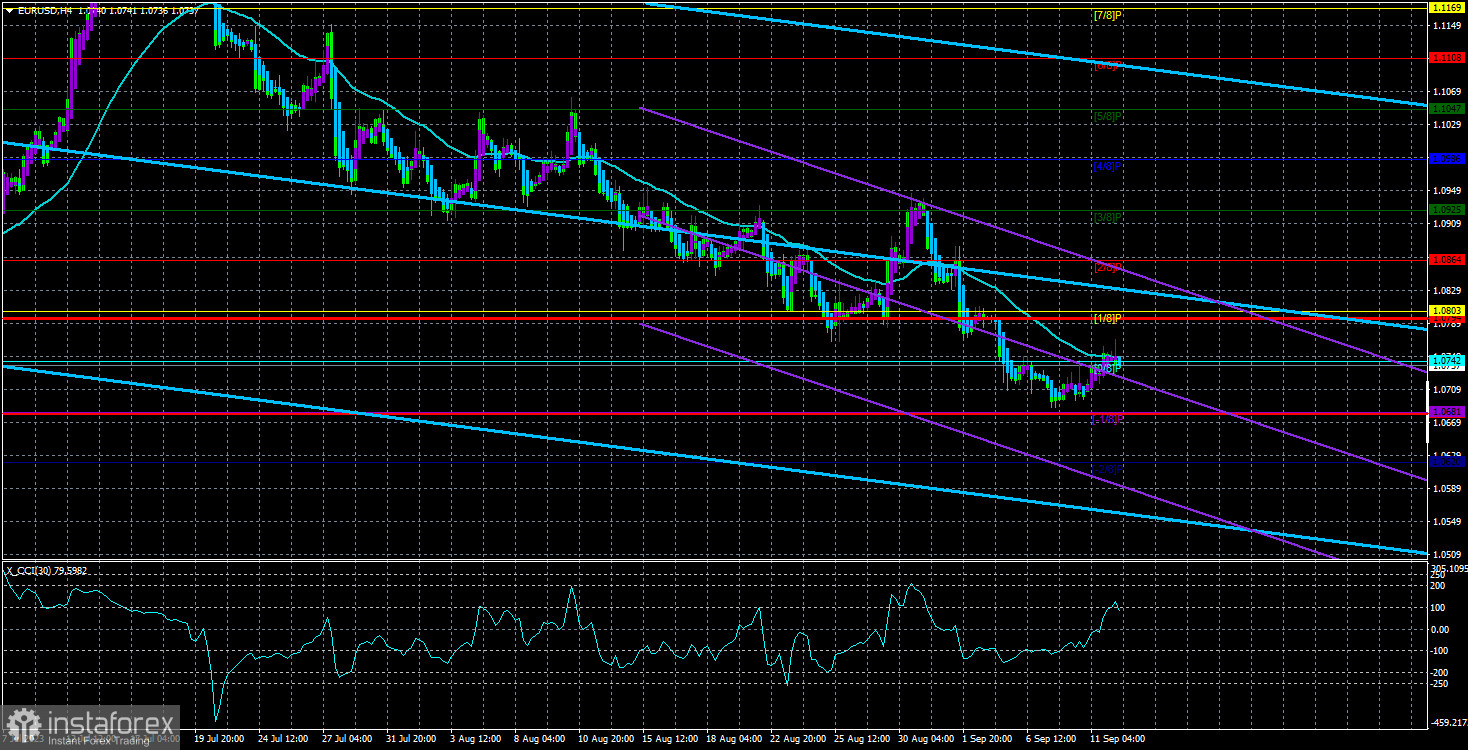
The EUR/USD currency pair exhibited low volatility during the week's first trading day. The price struggled to reach the moving average line and failed to establish itself above it. Therefore, at this moment, after a two-day correction, the downward trend persists. The movements of the past two to three days are insignificant for the pair's prospects. They were extremely weak, best characterized as "market noise." There were no macroeconomic data or fundamental events during these days, so the market briefly paused before the ECB meeting scheduled for this Thursday.
We have already mentioned that a correction was possible this week. A correction was probable even last week, but it didn't begin then. We have long been pointing out that the euro cannot keep rising indefinitely (especially without a solid foundation), and now we can say that it also cannot keep falling continuously without corrections. However, considering the strength of the fundamental background on Wednesday and Thursday, movements can be almost anything. Therefore, it's unlikely that the US dollar will find support this week, and we may witness a continuation of the downward trend.
The Eurozone economy will continue to slow down.
As previously mentioned, there have been almost no macroeconomic events in recent days. Nevertheless, on Monday, the European Commission released updated economic forecasts for the current and next years, and it's worth noting that these forecasts could surprise market participants. The current year's GDP forecast was revised to +0.8%, and for 2024, it was revised down to +1.3%. Germany's economy is expected to contract by 0.4% in 2023 and grow by 1.1% in 2024. It cannot be said that the market reacted strongly to this news, but this backdrop could continue to exert pressure on the European currency.
We have stated many times that the European economy is in a much worse position than the American one, and the numbers continue to confirm this. The ECB's interest rate will likely halt its rise just above the 4% level, significantly lower than the Fed's rate, which still needs to complete its upward movement. Because the dollar has consistently fallen over the past year, we still see no grounds for a strong euro strengthening. Thus, after the correction, we expect the euro to resume its decline regardless of the US inflation report and the decisions made by the ECB.
Today, there will again be very few macroeconomic and fundamental events, so movements in the pair may again be extremely weak. Over the past four trading days, the maximum volatility reached 54 points. With such market activity, trading even on the smallest timeframes makes little sense. What profit can traders expect? 10 points? On the 4-hour timeframe, trades must be kept open for at least several days, completely ignoring the Heiken Ashi indicator, which reacts quickly to reversals. But since there is practically no movement, all these reversals occur in the same place. We hope that movements will be more active on Wednesday and Thursday.
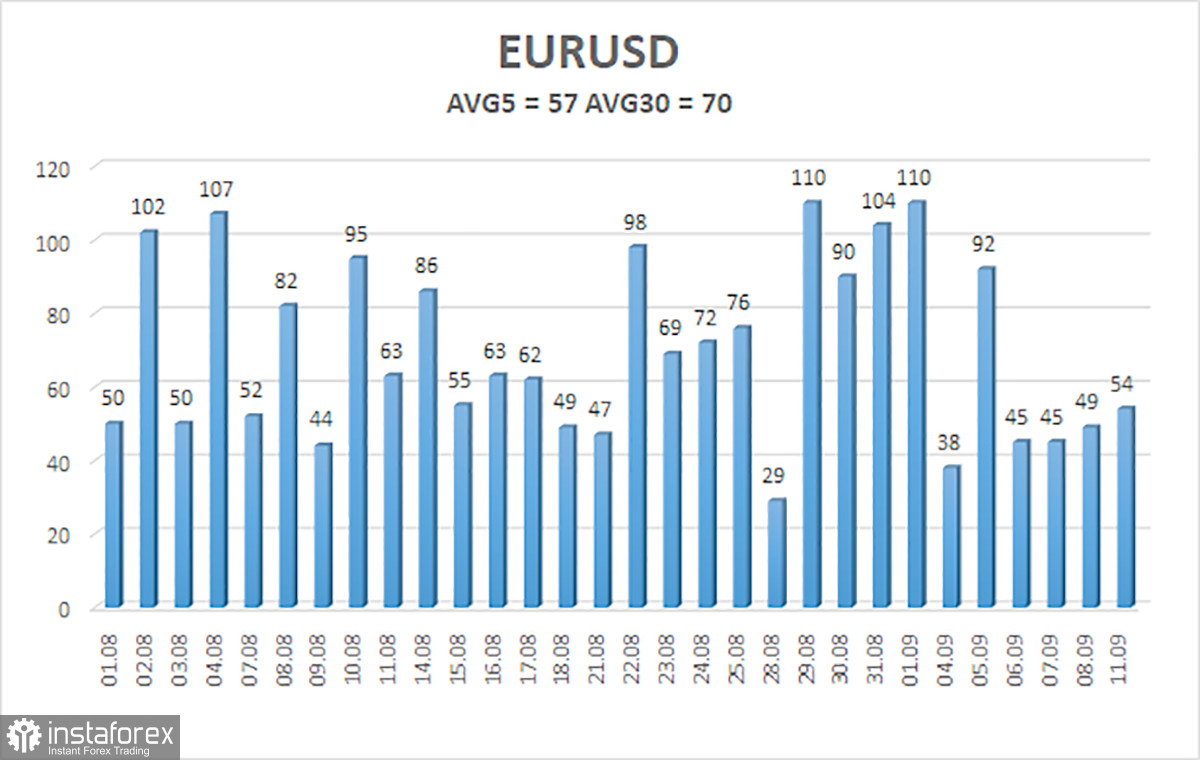
The average volatility of the EUR/USD currency pair for the past five trading days as of September 12th is 57 pips, characterized as "average." Therefore, on Tuesday, we expect the pair to move between the levels of 1.0680 and 1.0794. A reversal of the Heiken Ashi indicator downwards will indicate a possible resumption of the southward movement.
Nearest support levels:
S1 – 1.0681
S2 – 1.0620
Nearest resistance levels:
R1 – 1.0742
R2 – 1.0803
R3 – 1.0864
Trading recommendations:
The EUR/USD pair maintains a downtrend. New short positions can be considered with targets at 1.0681 and 1.0620 in case of a price bounce from the moving average line. Long positions can be considered if the price establishes itself above the moving average with targets of 1.0794 and 1.0864.
Explanations for the illustrations:
Linear regression channels - help determine the current trend. If both point in the same direction, it indicates a strong trend.
The moving average line (settings 20.0, smoothed) - determines the short-term trend and the direction in which trading should be conducted.
Murray levels - target levels for movements and corrections.
Volatility levels (red lines) - the likely price channel in which the pair will move in the next 24 hours, based on current volatility indicators.
CCI indicator - its entry into the overbought territory (above +250) or oversold territory (below -250) indicates an impending trend reversal in the opposite direction.


