EUR/USD

Higher Timeframes
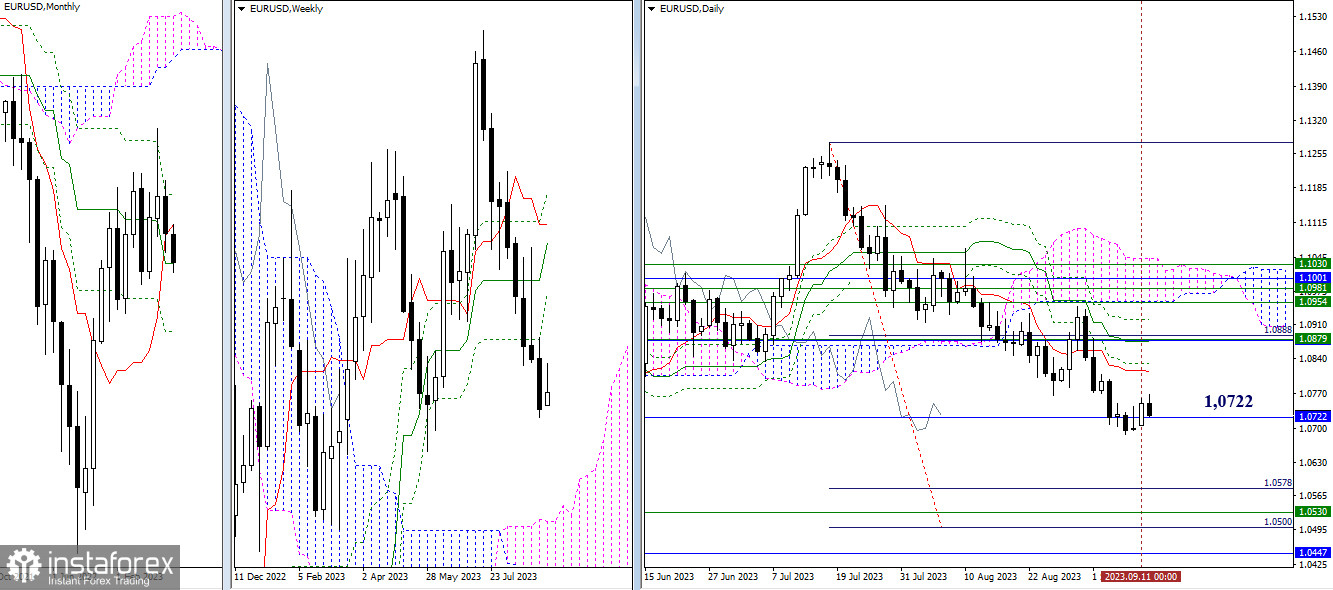
The monthly medium-term trend (1.0722) is holding back the situation's development. The attraction and strength of this level have managed to slow down the current downward process, replacing it with an upward corrective movement. The nearest correction target now is the resistance of the daily short-term trend (1.0814), and the significant zone is 1.0875–79 (daily medium-term trend + monthly short-term trend + weekly Fibonacci Kijun). Overcoming the attraction of the monthly level (1.0722) and revisiting the correction's low (1.0687) will refocus attention on a broad support zone, including the daily target for breaking the Ichimoku cloud (1.0500 – 1.0578), the upper boundary of the weekly cloud (1.0530), and the final level of the monthly Ichimoku cross (1.0447).

H4 – H1
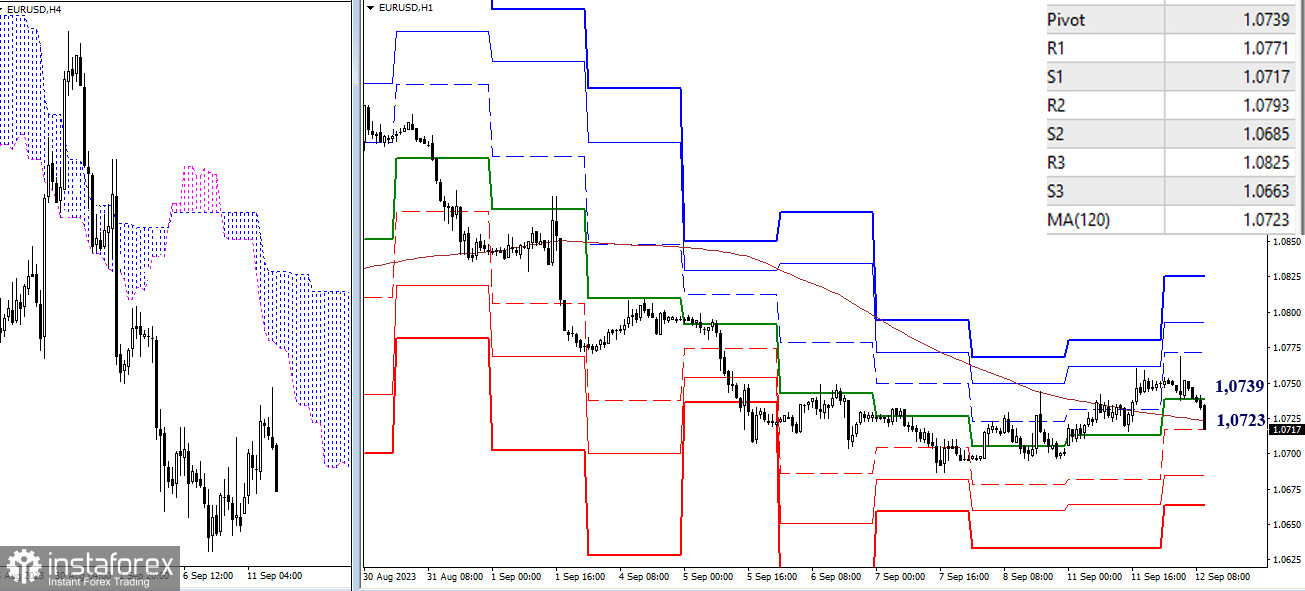
Executing the daily correction, bullish players on the lower timeframes managed to capture key levels, gaining a significant advantage. Currently, the pair is retesting the weekly long-term trend (1.0723). If this level can be maintained as support, a new upward phase may be possible, with intraday resistance levels becoming the focus (1.0771 – 1.0793 – 1.0825). If this support (1.0723) is lost, the main task for bearish players will be to exit the correction zone (1.0687) and continue the descent. Additional intraday support levels today can be noted at 1.0685 – 1.0663 (classic pivot points).
***
GBP/USD

Higher Timeframes
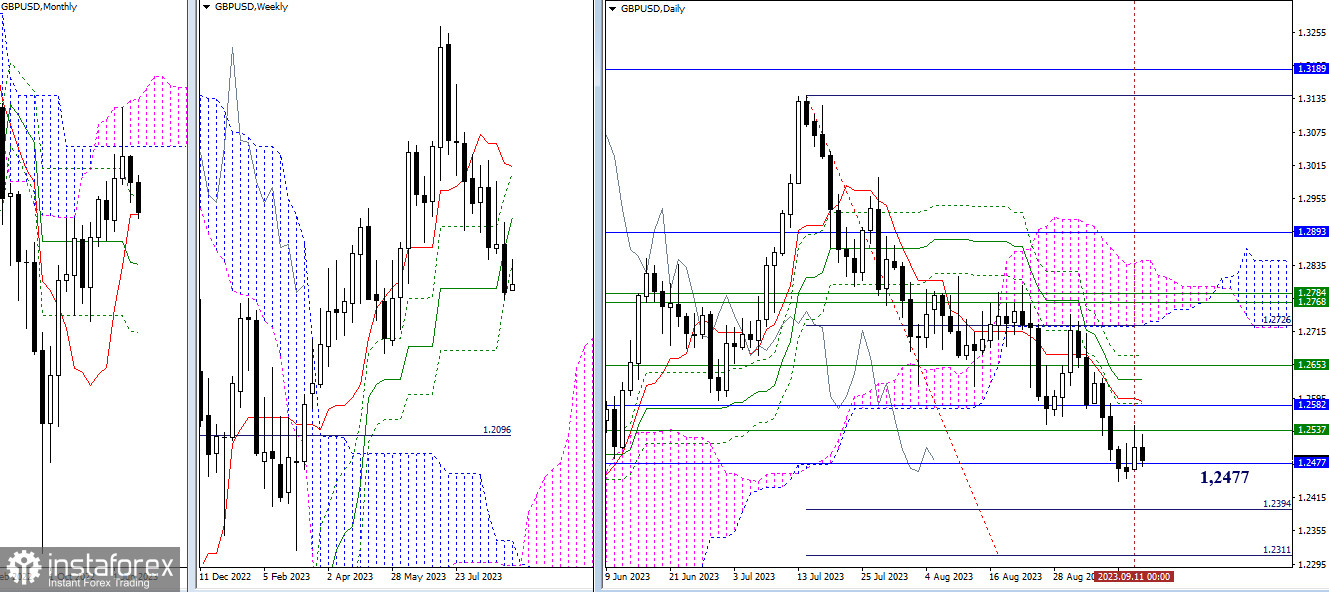
The attraction and influence of the monthly short-term trend (1.2477) are hindering the situation's development. Bullish players aim to use this circumstance to develop a corrective rise. However, various timeframes are currently presenting resistance on the path of correction, including 1.2537 (weekly Fibonacci Kijun) – 1.2582-89 (monthly Fibonacci Kijun + daily short-term trend). Exiting the correction zone (1.2444) and continuing the downward trend on the daily chart would allow for the consideration of testing the bearish target for breaking the Ichimoku cloud (1.2394 – 1.2311).

H4 – H1
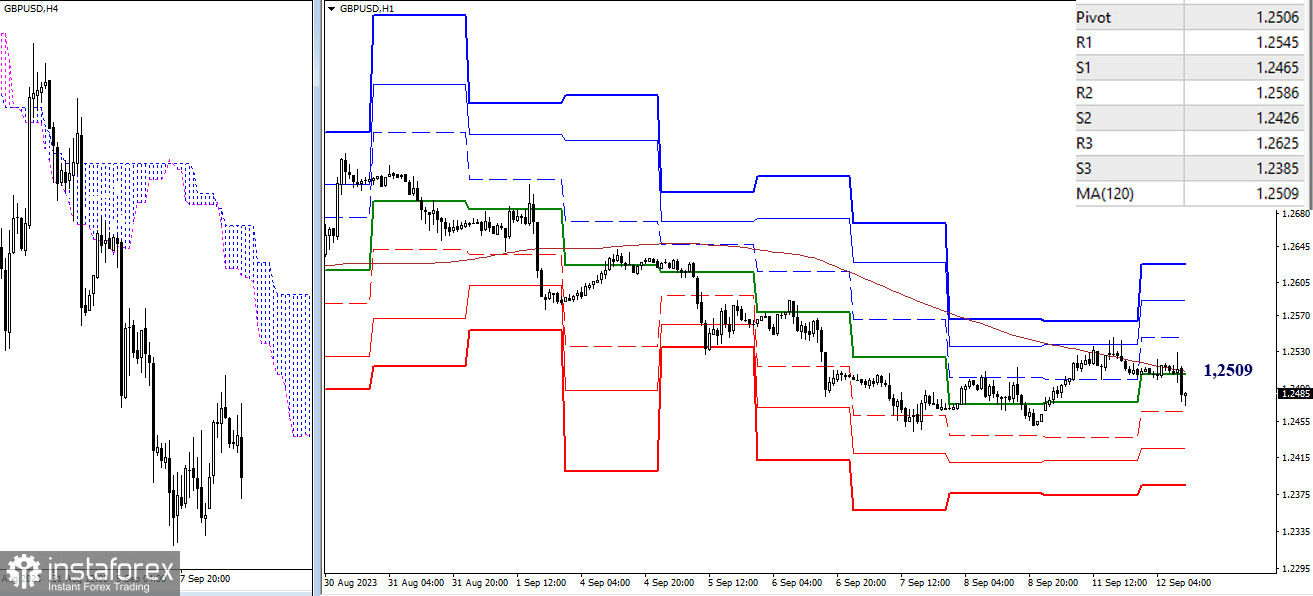
On the lower timeframes since yesterday, there has been a battle for the key level—the weekly long-term trend (1.2509). Bullish players have not been able to break its resistance so far. As a result, the main advantage remains on the bears' side. Strengthening bearish sentiment during the day may occur through breaking the support of classic pivot points (1.2465 – 1.2426 – 1.2385). If bullish players manage to capture 1.2509, their further ascent will go through intraday targets—the resistance of classic pivot points (1.2545 – 1.2586 – 1.2625).
***
The technical analysis of the situation uses:
Higher timeframes - Ichimoku Kinko Hyo (9.26.52) + Fibo Kijun levels
Lower timeframes - H1 - Pivot Points (classic) + Moving Average 120 (weekly long-term trend)


