


The EUR/USD currency pair once again grew almost out of nowhere. Yes, the growth was not strong, but what does it matter when the European currency rises practically every day? We did not see a normal correction after the CCI indicator entered the overbought zone for the fourth time. After last week's surge of the European currency against the backdrop of ECB and Fed meetings, we also did not see any corrections. In other words, no matter what happens in the world and the market, the European currency keeps growing.
Some analysts and experts try to explain this with a more "hawkish" ECB stance than the Fed. We believe this is not the case. It's like attributing yesterday's US GDP report to the fall of the new dollar. The dollar's decline on Thursday started several hours before the report, and after its publication, the American currency did not fall in price. Certainly, major players had inside information about this report hours before its publication, but then you can explain any market movement similarly. This forecasting method, or rather explaining what is happening, is incorrect.
The European currency is now rising because it is rising. Yes, it is a simplistic explanation, but consider an asset like Bitcoin. The world's first cryptocurrency has been growing rapidly for 15 years. And why is it growing? People buy it because they believe that Bitcoin is the future, because major investors manipulate the price, understanding that the supply of coins is limited and the fewer coins on the market, the higher the price. In other words, Bitcoin, in most cases, rises based on market faith or the actions of major players. The same thing is happening now with the euro currency.
Thus, the policies of the ECB and the Fed are the same. We still consider the current movement a correction and believe it will end sooner or later. However, predicting further growth of the euro currency based on fundamental and macroeconomic factors is something we cannot do.
The market once again interprets incoming information unilaterally. Someone might say: the ECB is signaling the first rate hike no earlier than the second half of 2024, while the Fed may cut rates as early as March. But on what basis is this conclusion made? Inflation in the EU is much lower than inflation in the US. Based on this fact, one can assume that the ECB will be the first to raise rates. Furthermore, representatives of the ECB and the Fed practically in unison stated this week that the market should not rush with expectations of rate cuts. In other words, both central banks may start lowering rates in the third quarter; both central banks are concerned that inflation will accelerate again in winter. However, the market still somehow believes that it will be the Fed that will start easing first.
Also, attention can be drawn to the CME FedWatch tool, which shows a 70% probability of a Fed rate cut in March and May. Unfortunately, this tool does not show an ECB rate cut probability. The market is guided by almost the same rhetoric of ECB and Fed representatives but draws completely different conclusions.
In general, any movement can be explained post facto. And if it's not possible, then an explanation can always be invented. Forecasting in Bitcoin is also relatively easy. If the asset is growing, it can always be said to continue growing. The market is currently trading illogically, but it is not obliged to make trading decisions based on fundamentals and macroeconomics. Therefore, if there are no sell signals, one should trade on technique and follow the trend.
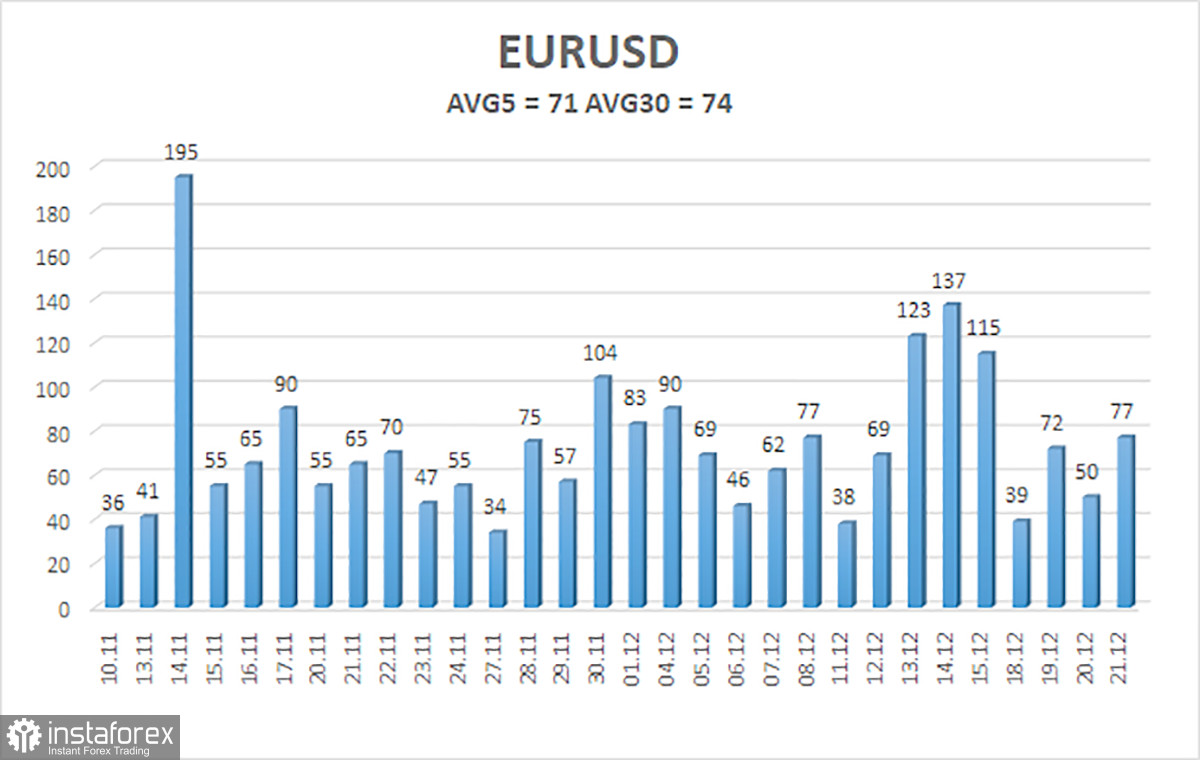
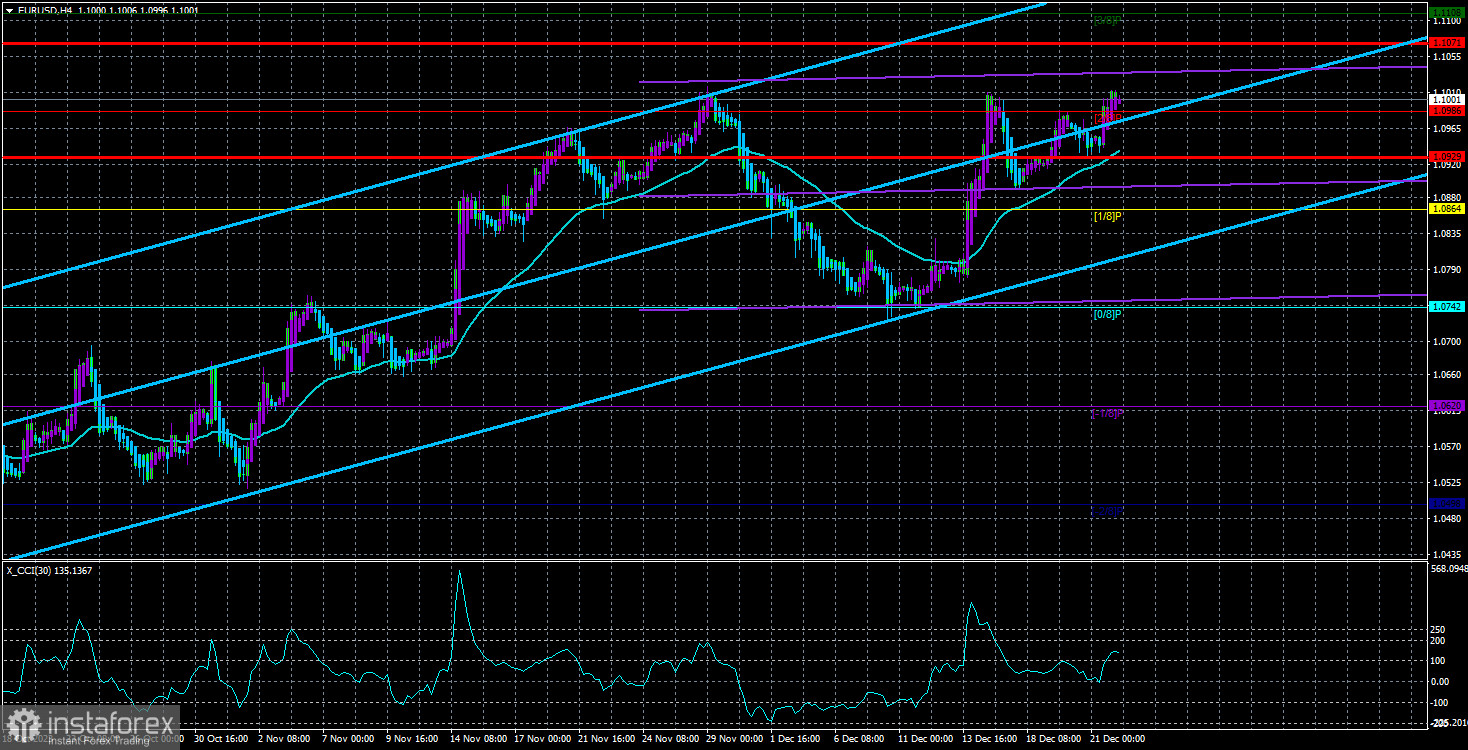
The average volatility of the euro/dollar currency pair for the last five trading days as of December 22 is 71 points and is characterized as "average." Thus, we expect the pair to move between the levels of 1.0929 and 1.1071 on Thursday. A downward reversal of the Heiken Ashi indicator will indicate a new twist in the corrective movement.
Nearest support levels:
S1 – 1.0986
S2 – 1.0864
S3 – 1.0742
Nearest resistance levels:
R1 – 1.1108
R2 – 1.1230
R3 – 1.1353
Trading recommendations:
The EUR/USD pair remains above the moving average line, but we still see no grounds for further growth. The price has already returned to the psychological level of $1.10, and if the third attempt to break through is successful, the uptrend will continue, and the euro will continue to rise. The overbought condition of the CCI indicator still indicates a much more likely decline. Short positions can be considered when consolidating below the moving average with a target of 1.0864.
Explanations for the illustrations:
Linear regression channels help determine the current trend. If both are directed in the same direction, the trend is strong.
The moving average line (settings 20.0, smoothed) determines the short-term trend and direction for trading.
Murray levels are target levels for movements and corrections.
Volatility levels (red lines) are the probable price channel for the pair to spend the next day, based on current volatility indicators.
CCI indicator – its entry into the oversold zone (below -250) or overbought zone (above +250) indicates that a trend reversal is approaching in the opposite direction.


