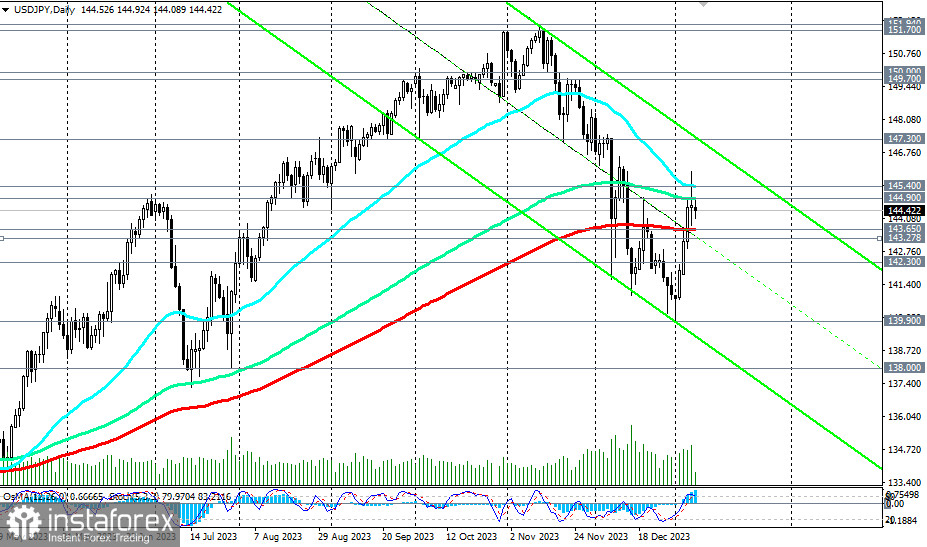
After last Thursday's publication of the strong ADP report and weekly U.S. labor market data, which indicated a decrease in the number of initial jobless claims, the dollar strengthened sharply, and the USD/JPY pair closely approached the important medium-term resistance level of 144.90 (144 EMA on the daily chart).
On Friday, the price finally broke through this resistance level amid the preliminary release of the U.S. Department of Labor's December report. However, market participants tempered their bullish sentiments towards the dollar after the strong December data from the Department of Labor were tarnished by revised downward NFP values for November and October.

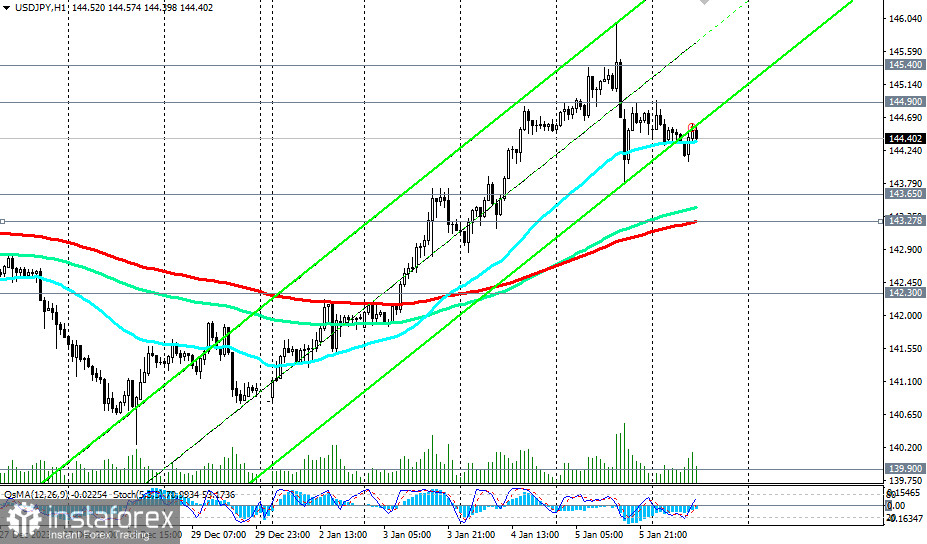
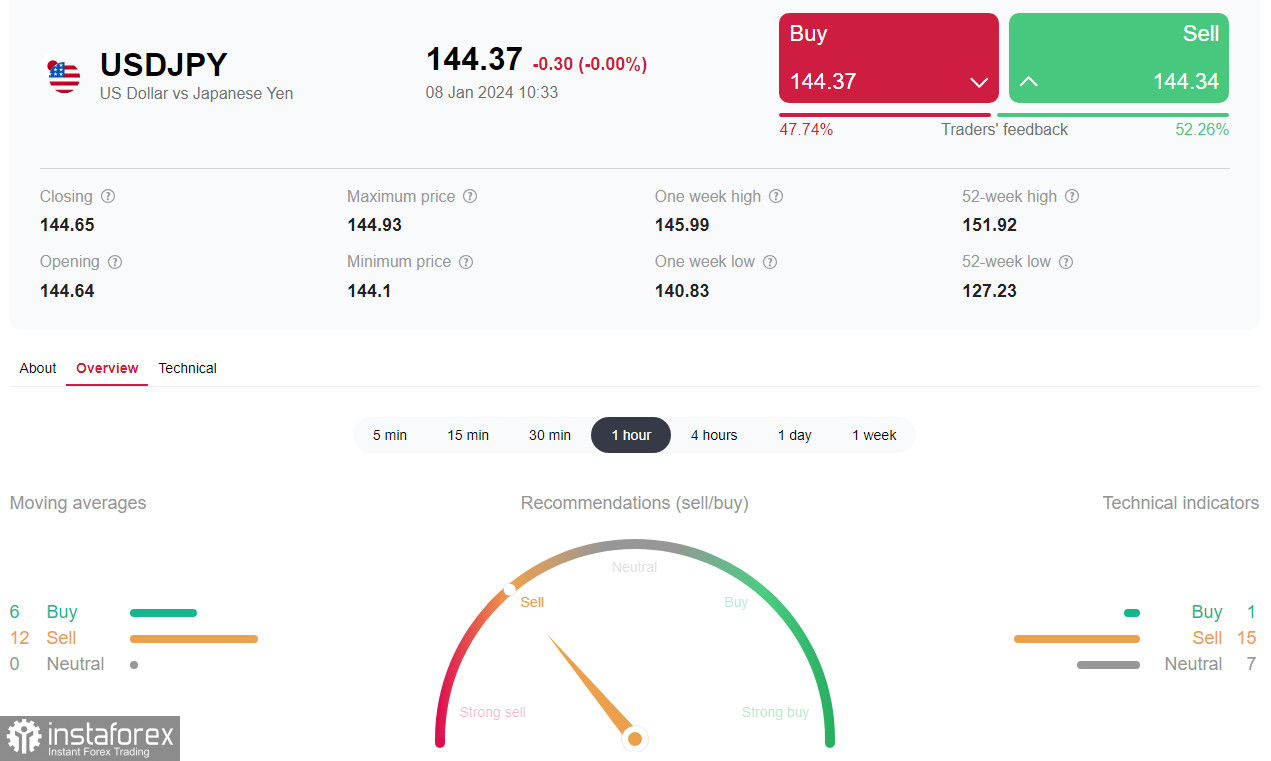
As a result, the dollar failed to capitalize on its success, and at the beginning of the new week, the USD/JPY pair is again declining. As of writing, it traded near the 144.40 mark, 20 points below Friday's closing price.
In case of further decline, breaking support levels of 143.65 (200 EMA on the daily chart) and 143.27 (200 EMA on the 1-hour chart) will signal the resumption of short positions in the pair.

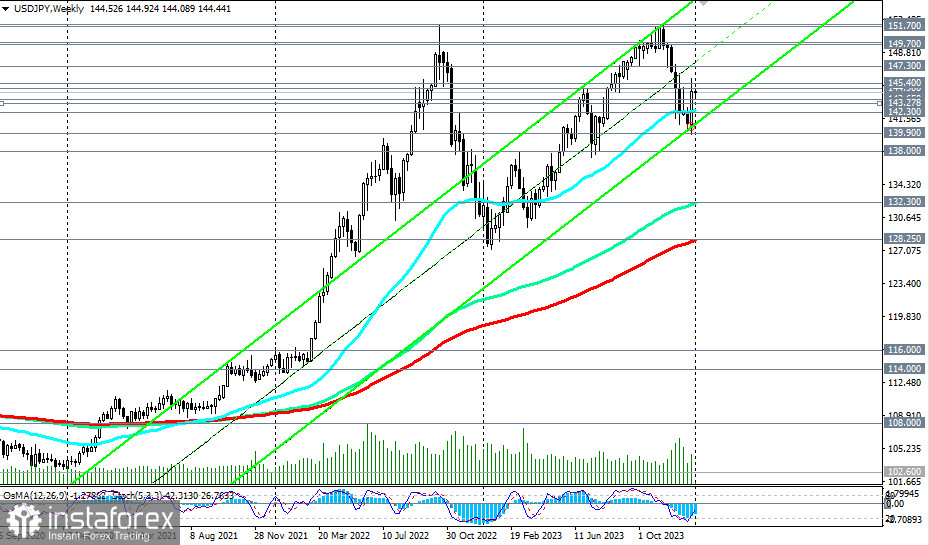
In this case, it will head deeper into the downward channel on the daily chart, towards its lower boundary, passing between local support levels 140.00 and 138.00.
Whether further decline will occur while USD/JPY remains within the long-term and global upward trends will depend much on the dynamics of both the yen and the dollar, which, in turn, will strongly react to any changes in the credit and monetary policies of the U.S. and Japan Central Banks.
For now long positions remain preferable, even above the support level of 143.65.

Here, a confirmed break of the important resistance level of 144.90 may be the first signal to build up long positions, and breaking the resistance level of 145.40 (50 EMA on the daily chart) and last week's high of 145.97 will be the confirmation.
Support levels: 144.00, 143.65, 143.27, 143.00, 142.30, 142.00, 141.00, 140.00, 139.00, 138.00
Resistance levels: 144.90, 145.00, 145.40, 146.00, 147.30, 148.00, 149.00, 149.70, 150.00, 151.00, 151.70, 151.95, 152.00, 153.00
Trading Scenarios:
Main Scenario
Aggressively: Buy at market. Stop Loss 143.80
Moderately: Buy Stop 145.20. Stop Loss 143.80
Targets 145.40, 146.00, 147.30, 148.00, 149.00, 149.70, 150.00, 151.00, 151.70, 151.95, 152.00, 153.00
Alternative Scenario
Aggressively: Sell Stop 143.80. Stop Loss 145.20
Moderately: Sell Stop 143.20. Stop Loss 144.20
Targets 143.00, 142.30, 142.00, 141.00, 140.00, 139.00, 138.00
"Targets" correspond to support/resistance levels. This does not mean that they will necessarily be reached, but they can serve as a guide when planning and placing your trading positions.


