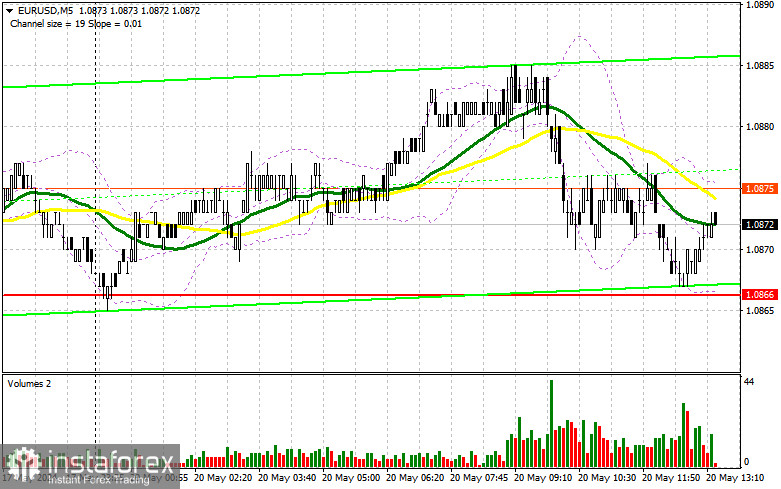
In my morning forecast, I paid attention to the 1.0866 level and planned to decide to enter the market based on it. Let's look at the 5-minute chart and figure out what happened there. A decrease to this level occurred but never reached the test, and a false breakdown was formed there. For this reason, getting suitable entry points into the market was impossible. Considering that we remained trading within the channel, the technical picture still needed to be revised for the second half of the day.

To open long positions on EURUSD, you need:
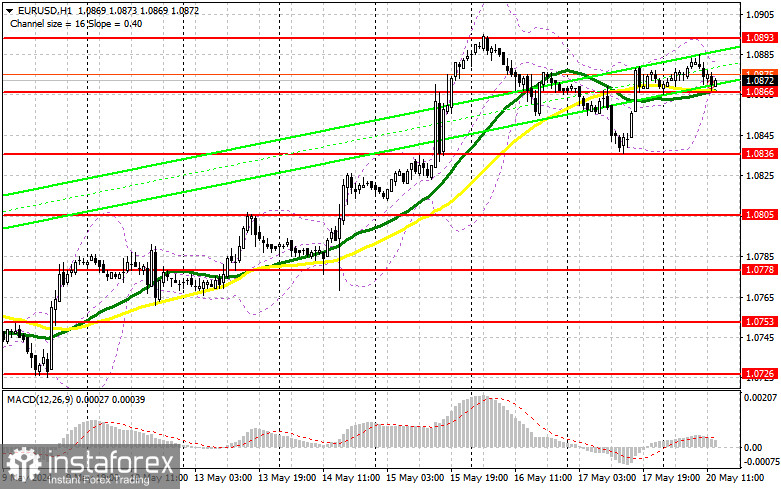
Unfortunately, in the afternoon, apart from the speech of the representative of the Federal Reserve System, Christopher Waller, there are no fundamental statistics, so it is unlikely that we will see strong and directional movements. For this reason, it is better to try to trade the nearest levels and count on reverse movements from them. I will act on a decline in the support area of 1.0866, which we did not reach in the first half of the day. Forming a false breakdown will be a suitable option for entering the market with the expectation of further growth in the area of 1.0893. A breakout and a top-down update of this range against a lack of statistics will strengthen the pair with a chance of a breakthrough to 1.0918 – a new weekly high. The farthest target will be a maximum of 1.0942, where I will record profits. If EUR/USD declines and there is no activity in the 1.0866 area in the afternoon, the pressure on the market will increase, leading to a larger drop in the pair to the 1.0836 area. I will also enter there only after the formation of a false breakdown. I plan to open long positions immediately for a rebound from 1.0805 with the aim of an upward correction of 30-35 points within the day.
To open short positions on EURUSD, you need:
Sellers have every chance to keep the market in the side channel and to return the initiative. To do this, you must show yourself in the resistance area 1.0893. This increase can occur in the case of a soft speech by a representative of the Fed, which, together with a false breakdown, will be a good scenario for opening short positions with the prospect of a decline in the euro and an update of support at 1.0866. The moving averages are also located there, playing again on the buyers' side. A breakout and consolidation below this range and a reverse bottom-up test will give another selling point, with the pair moving to the low of 1.0836, where I expect to see a more active manifestation of buyers. The farthest target will be a minimum of 1.0805, where I will record profits. In the event of an upward movement of EUR/USD in the afternoon and the absence of bears at 1.0893, the bullish trend will continue. In this event, I will postpone sales until the test of the next resistance of 1.0918. I will also sell there, but only after an unsuccessful consolidation. I plan to open short positions immediately for a rebound from 1.0942 with the aim of a downward correction of 30-35 points.
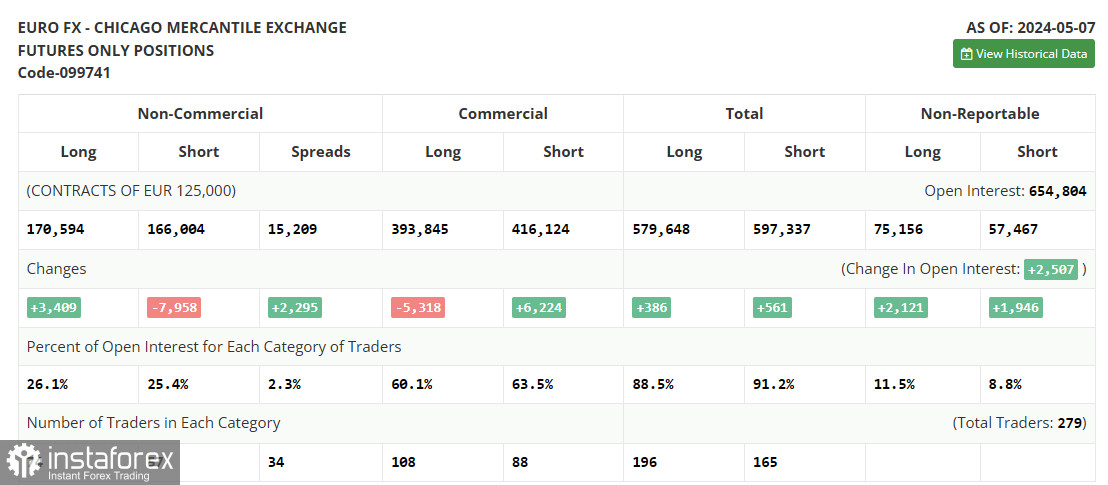
The COT report (Commitment of Traders) for May 7 showed a reduction in short positions and an increase in long ones. After the meetings of the central banks, the demand for risky assets remains rather weak. The fact that the number of long and short positions is almost equal indicates no advantage for either side, which the graph confirms. Now, traders will wait for new statistics and benchmarks, but trading will continue in the side channel, with a slight advantage for buyers of risky assets. The COT report indicates that long non-profit positions increased by 3,409 to 170,594, while short non-profit positions fell by 7,958 to 166,004. As a result, the spread between long and short positions increased by 2,295.

Indicator signals:
Moving averages
Trading is conducted around the 30 and 50-day moving averages, which indicates market uncertainty.
Note: The author considers the period and prices of the moving averages on the hourly chart H1, which differ from the general definition of the classic daily moving averages on the daily chart D1.
Bollinger Bands
In case of a decline, the lower limit of the indicator in the area of 1.0866 will act as support.
Description of the indicators
• Moving average (moving average determines the current trend by smoothing volatility and noise). Period 50. It is marked in yellow on the chart.
• Moving average (moving average determines the current trend by smoothing volatility and noise). Period 30. It is marked in green on the chart.
• MACD indicator (Moving Average Convergence/Divergence — convergence/divergence of moving averages) Fast EMA period 12. Slow EMA period 26. SMA period 9
• Bollinger Bands. Period 20
• Non-profit speculative traders, such as individual traders, hedge funds and large institutions that use the futures market for speculative purposes and meet certain requirements.
• Long non-commercial positions represent the total long open position of non-commercial traders.
• Short non-commercial positions represent the total short open position of non-commercial traders.
• The total non-commercial net position is the difference between non-commercial traders' short and long positions.


