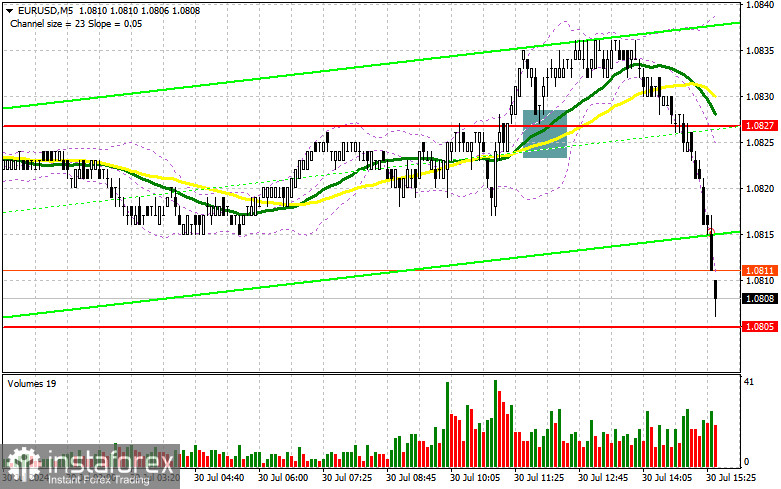
In my morning forecast, I highlighted the level at 1.0827 and planned to make market entry decisions based on this level. Let's look at the 5-minute chart to understand what happened. The breakout and retest provided an entry point for buying euros, but the pair did not make a significant move despite positive statistics from the Eurozone. This led to an exit from the market and a revision of the strategy. The technical outlook remained unchanged for the second half of the day.

To Open Long Positions on EUR/USD:
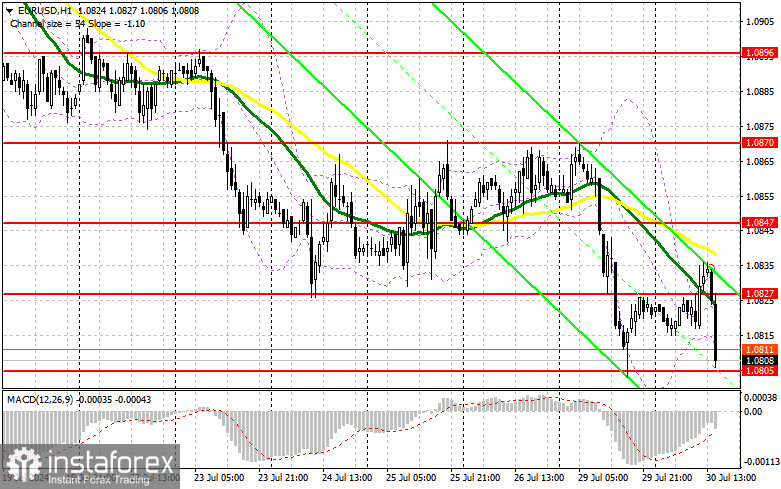
The Eurozone GDP was encouraging, as growth was noted both quarterly and yearly. However, we are awaiting important data on the U.S. Consumer Confidence Index and the S&P/Case-Shiller 20-City Home Price Index. Alongside these, the Housing Price Index report will also be released. Only very poor results can harm the current bearish market for the pair, as there is a lack of interest in buying risky assets. In case the pair declines, forming a false breakout at 1.0805 will be a suitable condition for increasing long positions, aiming for a rise with a prospect of updating the mid-channel at 1.0827. A breakout and consolidation above this range will strengthen the pair with a chance to rise to the area of 1.0847. The furthest target will be the 1.0870 level, where I will take profit. If EUR/USD declines and there is no activity around 1.0805 in the second half of the day, which is a technically significant level, sellers will regain the initiative and start building a downtrend. In this case, I will enter only after forming a false breakout around 1.0785. I plan to open long positions immediately on a rebound from 1.0757, aiming for an upward correction of 30 to 35 points within the day.
To Open Short Positions in EUR/USD:
Sellers remain in control, and in case of an upward correction of the pair in the second half of the day amid weak U.S. data, only a false breakout at the new resistance level of 1.0827 will confirm the presence of large players betting on the euro's decline, providing a suitable entry point for short positions aiming for a decline to the support level at 1.0805, which proved reliable yesterday. A breakout and consolidation below this range, followed by a retest from below, will offer another selling point with a move towards 1.0785, where I expect a more active buyer response. The furthest target will be the 1.0757 level, where I will take profit. If EUR/USD rises in the second half and there are no bears at 1.0827, buyers will feel stronger, aiming for larger growth. In this case, I will delay selling until testing the next resistance at 1.0847, where I will also sell only after a failed consolidation. I plan to open short positions immediately on a rebound from 1.0870, targeting a downward correction of 30 to 35 points.

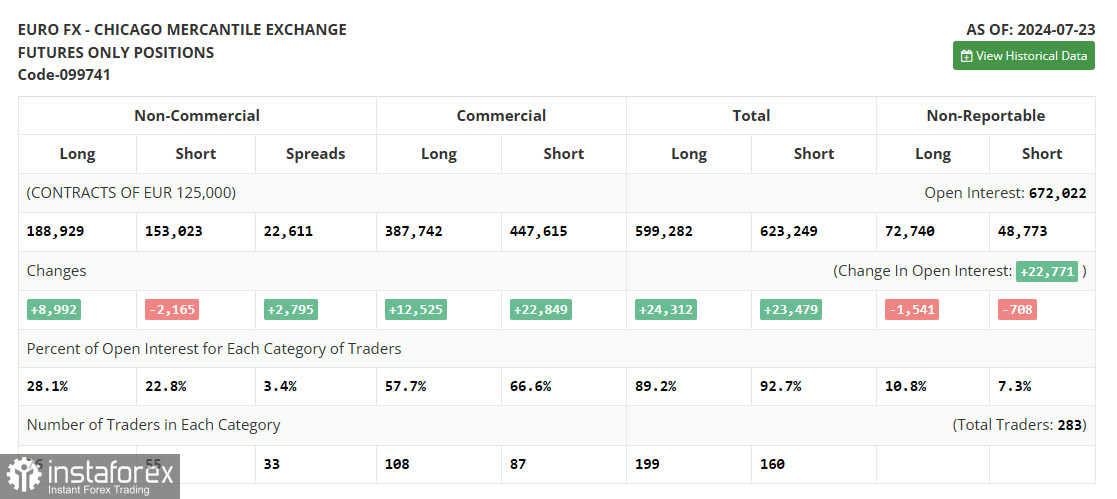
In the Commitment of Traders (COT) Report for July 23, there was a reduction in short positions and an increase in long positions. However, nothing significant changed in the balance of power before the Federal Reserve meeting, despite talks that the U.S. regulator should start lowering interest rates, supported by recent economic data. The market remains balanced, and it's possible to take advantage of cheaper risky assets, including the euro, by anticipating that the Fed will eventually lower rates this year. The COT report indicated that long non-commercial positions rose by 8,992, reaching 188,929, while short non-commercial positions decreased by 2,165, reaching 153,023. As a result, the spread between long and short positions increased by 2,795.
Indicator Signals:
Moving Averages: Trading is below the 30 and 50-day moving averages, indicating a euro decline.Note: The period and prices of the moving averages are considered by the author on the hourly H1 chart and differ from the general definition of classical daily moving averages on the D1 chart.
Bollinger Bands: In case of a decline, the lower boundary of the indicator, around 1.0840, will act as support.
Indicator Descriptions:
- Moving Average: Determines the current trend by smoothing volatility and noise. Period – 50. Marked in yellow on the chart.
- Moving Average: Determines the current trend by smoothing volatility and noise. Period – 30. Marked in green on the chart.
- MACD (Moving Average Convergence/Divergence): Fast EMA – period 12. Slow EMA – period 26. SMA – period 9.
- Bollinger Bands: Period – 20.
- Non-commercial traders: Speculators such as individual traders, hedge funds, and large institutions using the futures market for speculative purposes and meeting certain requirements.
- Long non-commercial positions: Represent the total long open position of non-commercial traders.
- Short non-commercial positions: Represent the total short open position of non-commercial traders.
- Total non-commercial net position: The difference between the short and long positions of non-commercial traders.


