


Trade Analysis and Tips for Trading the Japanese Yen
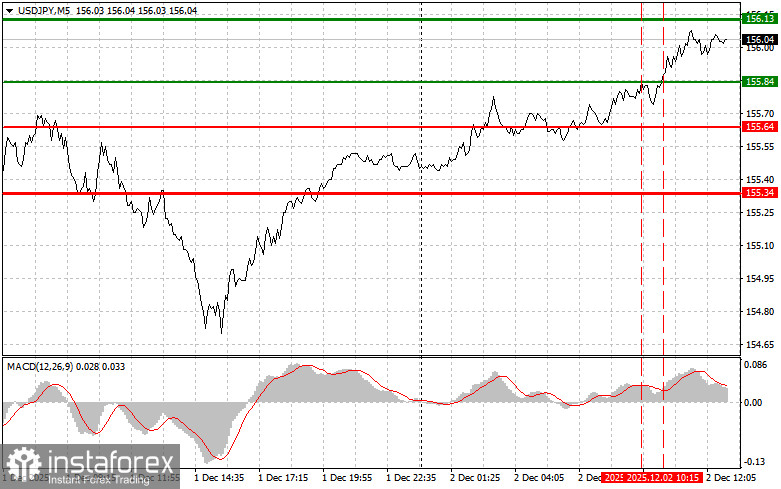
The price test of 155.84 occurred when the MACD indicator had already moved far above the zero line, which limited the pair's upward potential. For this reason, I did not buy the dollar. The second test of 155.84 coincided with the MACD being in the overbought area, which activated scenario No. 2 for selling. However, the pair never actually declined, resulting in a loss.
Will the situation in the market shift in favor of the Japanese yen after the release of the U.S. RCM/TIPP Economic Optimism Index? Unlikely. Most likely, the dollar will maintain its leading position in the pair with the yen, since this indicator does not directly affect the U.S. currency. There is also little reason to expect anything from FOMC member Michelle Bowman's speech—she is unlikely to touch on monetary policy, especially ahead of the upcoming Fed meeting next week.
As for the intraday strategy, I will rely primarily on scenarios No. 1 and No. 2.
Buy Signal
Scenario No. 1: I plan to buy USD/JPY today upon reaching the entry point around 156.12 (green line on the chart), targeting growth toward 156.38 (the thicker green line on the chart). Near 156.38, I will exit long positions and open short positions in the opposite direction (expecting a 30–35-point pullback from that level). The pair may rise within the intraday upward trend. Important! Before buying, make sure the MACD indicator is above the zero line and just beginning to rise from it.
Scenario No. 2: I also plan to buy USD/JPY today in the event of two consecutive tests of 155.95 when the MACD indicator is in the oversold area. This will limit the pair's downward potential and lead to a market reversal upward. Growth toward the opposite levels of 156.12 and 156.38 can be expected.
Sell Signal
Scenario No. 1: I plan to sell USD/JPY today after a breakout below 155.95 (red line on the chart), which should lead to a quick decline. The key target for sellers will be 155.75, where I will exit short positions and immediately open long positions in the opposite direction (expecting a 20–25-point pullback from that level). Pressure on the pair will return only if U.S. data is very weak. Important! Before selling, make sure the MACD indicator is below the zero line and just beginning to decline from it.
Scenario No. 2: I also plan to sell USD/JPY today if there are two consecutive tests of 156.12 when the MACD indicator is in the overbought area. This will limit the pair's upward potential and lead to a downward reversal. A decline toward 155.95 and 155.75 can be expected.
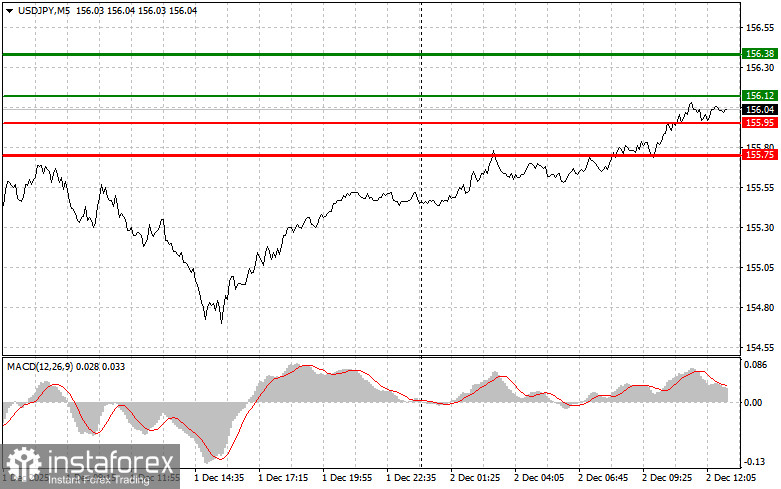
Chart Legend
- Thin green line – entry price at which you can buy the trading instrument.
- Thick green line – suggested price for placing Take Profit or manually securing profits, as further growth is unlikely above this level.
- Thin red line – entry price at which you can sell the trading instrument.
- Thick red line – suggested price for placing Take Profit or manually securing profits, as further decline is unlikely below this level.
- MACD indicator – When entering the market, it is important to consider overbought and oversold zones.
Important: Beginner Forex traders must be very cautious when making entry decisions. Before major fundamental releases, it is best to stay out of the market to avoid sharp price swings. If you decide to trade during news releases, always place stop orders to minimize losses. Without stop orders, you can quickly lose your entire deposit—especially if you do not use money management and trade large volumes.
And remember: for successful trading, you need a clear trading plan, like the one outlined above. Spontaneous decision-making based on the current market situation is, from the start, a losing strategy for an intraday trader.


