


FX.co ★ Modèles réels. Analyse technique et recommandations de trading
Modèles réels

Double Bottom
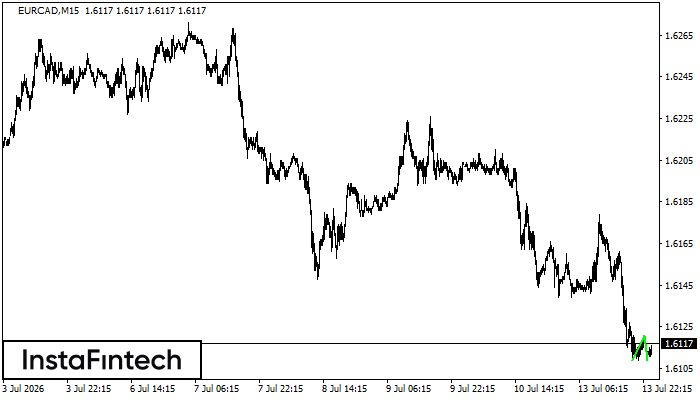
The Double Bottom pattern has been formed on EURCAD M15. Characteristics: the support level 1.6109; the resistance level 1.6121; the width of the pattern 12 points. If the resistance level is broken, a change in the trend can be predicted with the first target point lying at the distance of 12 points.
Bearish Rectangle
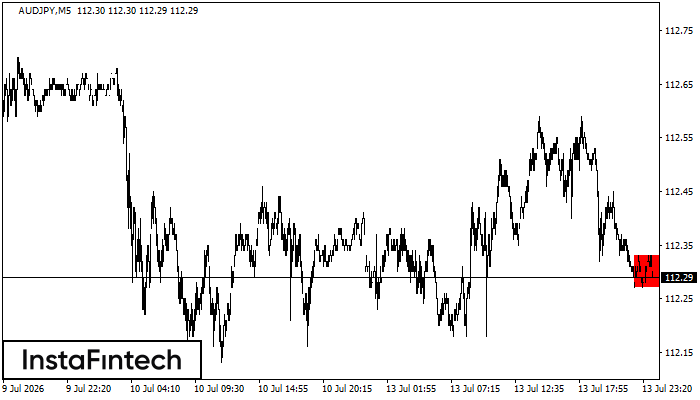
According to the chart of M5, AUDJPY formed the Bearish Rectangle. This type of a pattern indicates a trend continuation. It consists of two levels: resistance 112.33 - 0.00 and support 112.27 – 112.27. In case the resistance level 112.27 - 112.27 is broken, the instrument is likely to follow the bearish trend.
Double Top
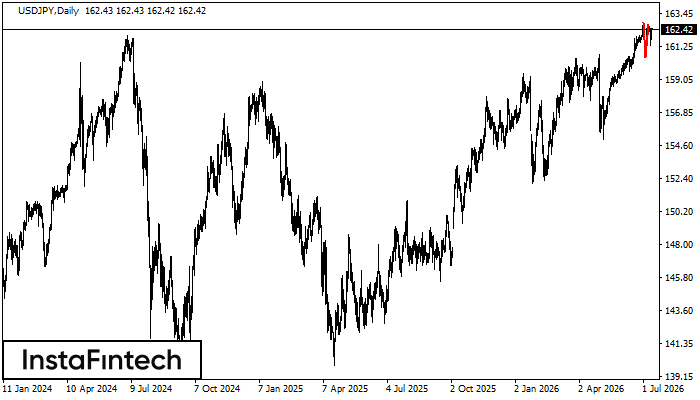
The Double Top reversal pattern has been formed on USDJPY D1. Characteristics: the upper boundary 162.85; the lower boundary 160.51; the width of the pattern is 221 points. Sell trades are better to be opened below the lower boundary 160.51 with a possible movements towards the 160.11 level.
Bearish Symmetrical Triangle

According to the chart of M5, #Bitcoin formed the Bearish Symmetrical Triangle pattern. This pattern signals a further downward trend in case the lower border 61824.38 is breached. Here, a hypothetical profit will equal the width of the available pattern that is -67819 pips.
Triple Bottom
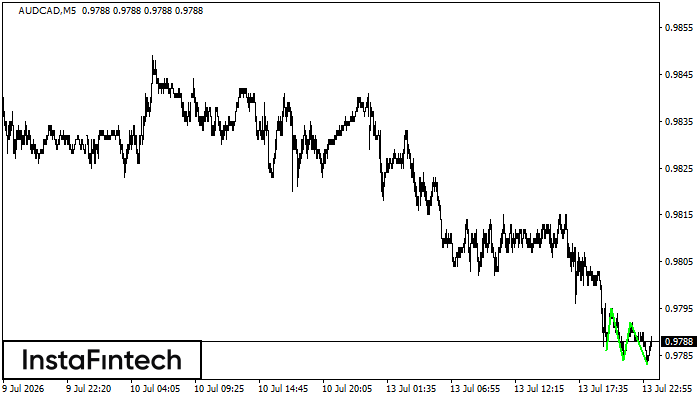
The Triple Bottom pattern has formed on the chart of the AUDCAD M5 trading instrument. The pattern signals a change in the trend from downwards to upwards in the case of breakdown of 0.9795/0.9792.


