


FX.co ★ Modèles réels. Analyse technique et recommandations de trading
Modèles réels

Double Top
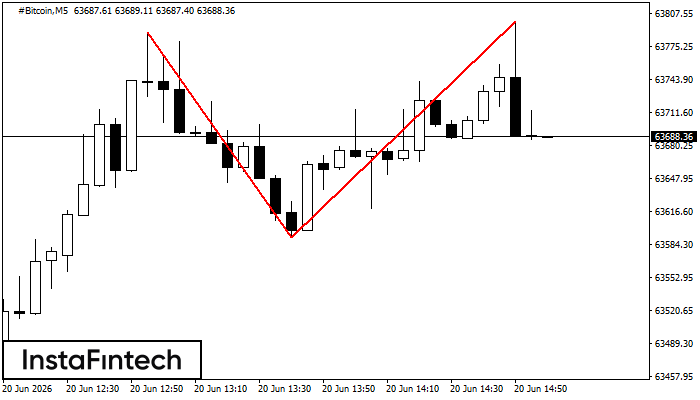
On the chart of #Bitcoin M5 the Double Top reversal pattern has been formed. Characteristics: the upper boundary 63799.59; the lower boundary 63591.71; the width of the pattern 20788 points. The signal: a break of the lower boundary will cause continuation of the downward trend targeting the 63591.56 level.
Bearish Symmetrical Triangle
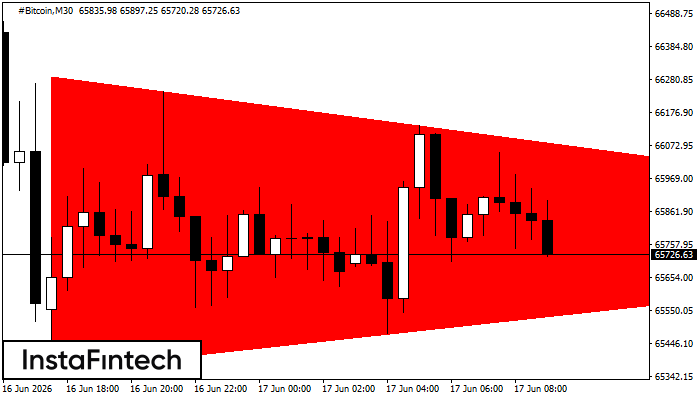
According to the chart of M30, #Bitcoin formed the Bearish Symmetrical Triangle pattern. Trading recommendations: A breach of the lower border 65360.39 is likely to encourage a continuation of the downward trend.
Bearish Symmetrical Triangle
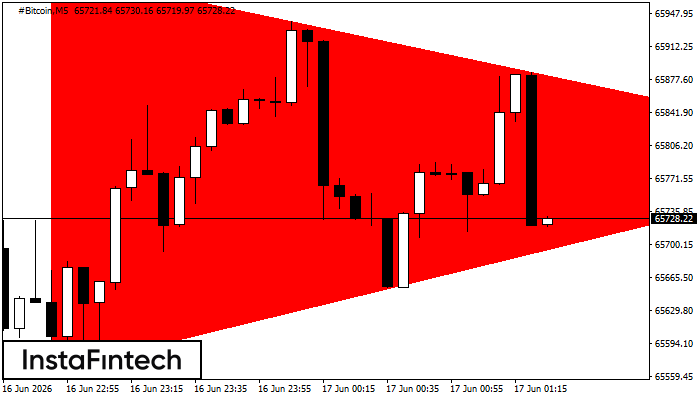
According to the chart of M5, #Bitcoin formed the Bearish Symmetrical Triangle pattern. Trading recommendations: A breach of the lower border 65565.70 is likely to encourage a continuation of the downward trend.
Double Bottom
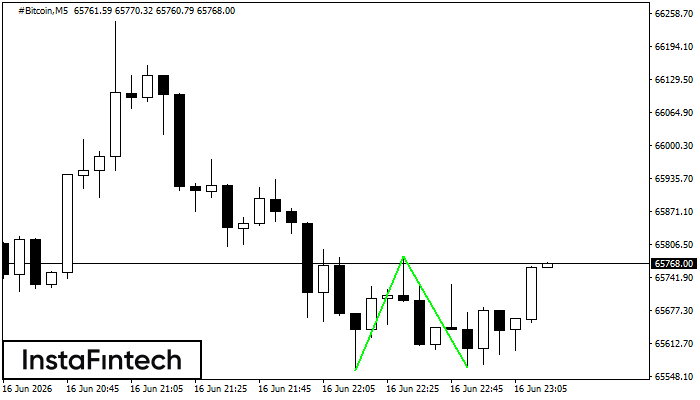
The Double Bottom pattern has been formed on #Bitcoin M5; the upper boundary is 65781.74; the lower boundary is 65565.70. The width of the pattern is 22225 points. In case of a break of the upper boundary 65781.74, a change in the trend can be predicted where the width of the pattern will coincide with the distance to a possible take profit level.
Double Bottom
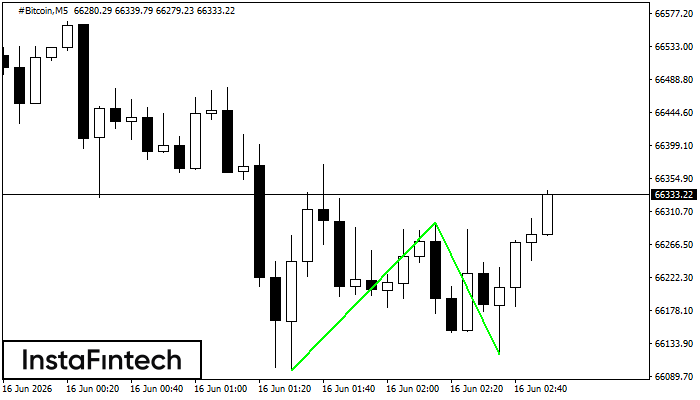
The Double Bottom pattern has been formed on #Bitcoin M5. This formation signals a reversal of the trend from downwards to upwards. The signal is that a buy trade should be opened after the upper boundary of the pattern 66296.15 is broken. The further movements will rely on the width of the current pattern 19863 points.


