


FX.co ★ Modèles réels. Analyse technique et recommandations de trading
Modèles réels

Triple Top
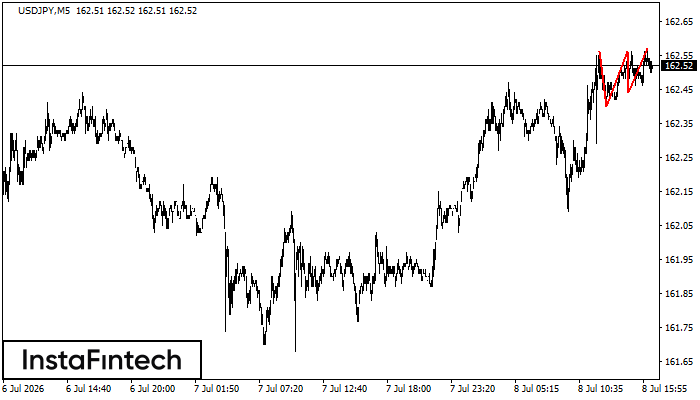
The Triple Top pattern has formed on the chart of the USDJPY M5 trading instrument. It is a reversal pattern featuring the following characteristics: resistance level -1, support level -4, and pattern’s width 16. Forecast If the price breaks through the support level 162.40, it is likely to move further down to 162.41.
Double Top
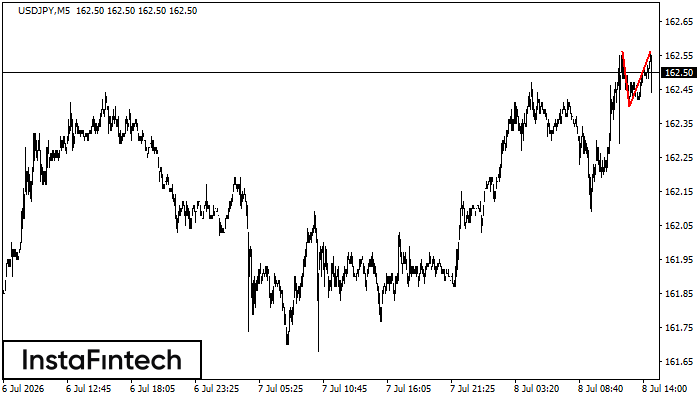
The Double Top pattern has been formed on USDJPY M5. It signals that the trend has been changed from upwards to downwards. Probably, if the base of the pattern 162.40 is broken, the downward movement will continue.
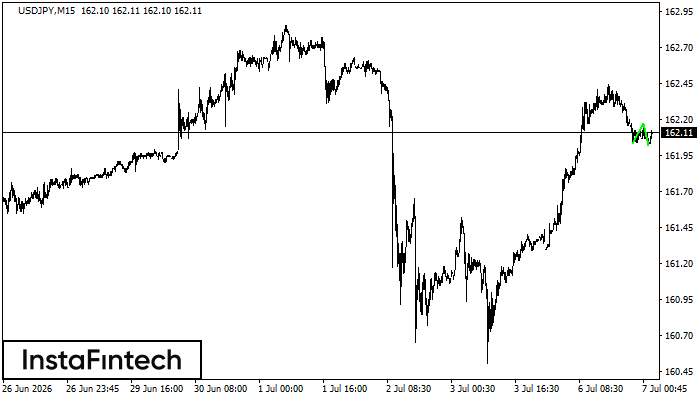
Head and Shoulders
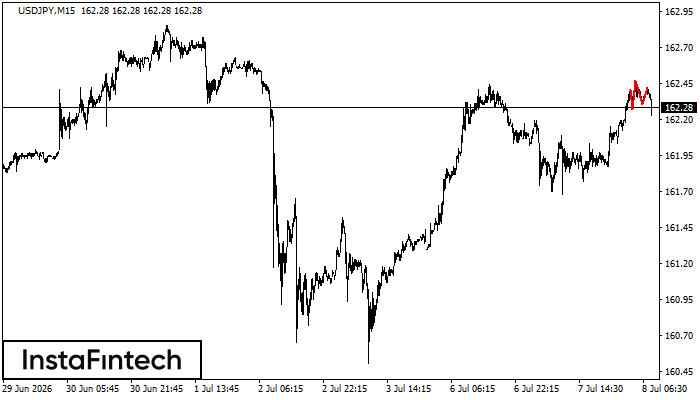
According to the chart of M15, USDJPY formed the Head and Shoulders pattern. The Head’s top is set at 162.47 while the median line of the Neck is found at 162.27/162.30. The formation of the Head and Shoulders pattern evidently signals a reversal of the upward trend. In other words, in case the scenario comes true, the price of USDJPY will go towards 162.07.
Bearish Rectangle
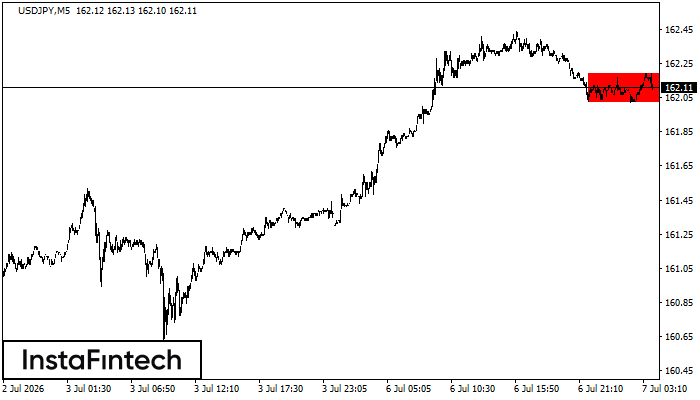
According to the chart of M5, USDJPY formed the Bearish Rectangle which is a pattern of a trend continuation. The pattern is contained within the following borders: lower border 162.02 – 162.02 and upper border 162.19 – 162.19. In case the lower border is broken, the instrument is likely to follow the downward trend.
Double Bottom
The Double Bottom pattern has been formed on USDJPY M15; the upper boundary is 162.17; the lower boundary is 162.02. The width of the pattern is 14 points. In case of a break of the upper boundary 162.17, a change in the trend can be predicted where the width of the pattern will coincide with the distance to a possible take profit level.


