


FX.co ★ Modèles réels. Analyse technique et recommandations de trading
Modèles réels

Triple Top
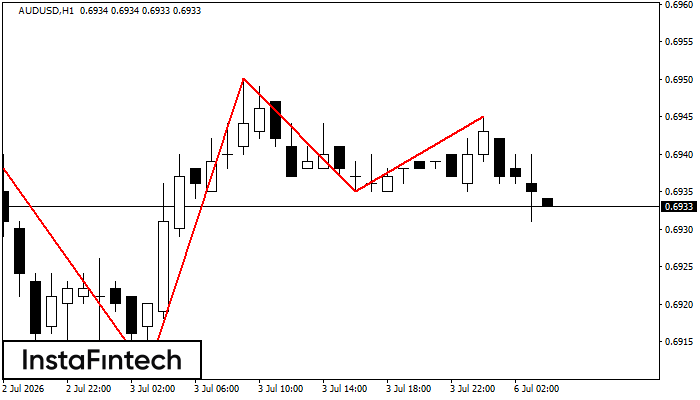
The Triple Top pattern has formed on the chart of the AUDUSD H1 trading instrument. It is a reversal pattern featuring the following characteristics: resistance level -1, support level -24, and pattern’s width 33. Forecast If the price breaks through the support level 0.6911, it is likely to move further down to 0.6910.
Head and Shoulders
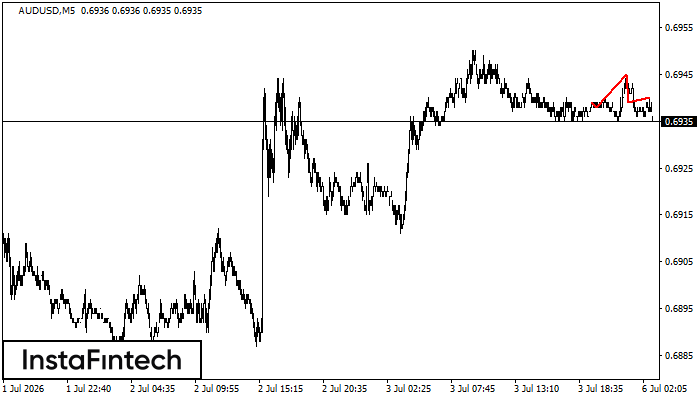
The technical pattern called Head and Shoulders has appeared on the chart of AUDUSD M5. There are weighty reasons to suggest that the price will surpass the Neckline 0.6938/0.6939 after the right shoulder has been formed. So, the trend is set to change with the price heading for 0.6924.
Bearish Rectangle
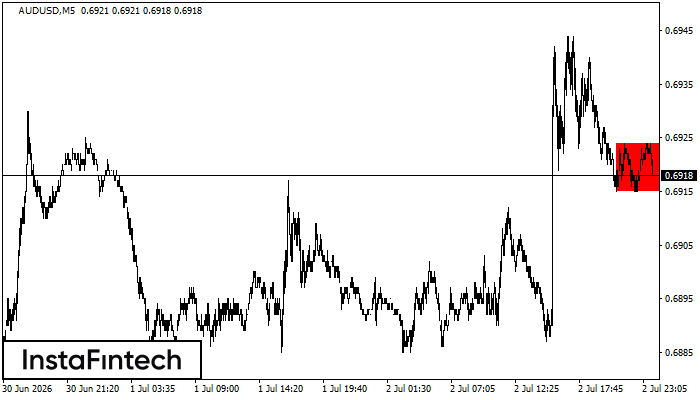
According to the chart of M5, AUDUSD formed the Bearish Rectangle. This type of a pattern indicates a trend continuation. It consists of two levels: resistance 0.6924 - 0.0000 and support 0.6915 – 0.6915. In case the resistance level 0.6915 - 0.6915 is broken, the instrument is likely to follow the bearish trend.
Triple Top
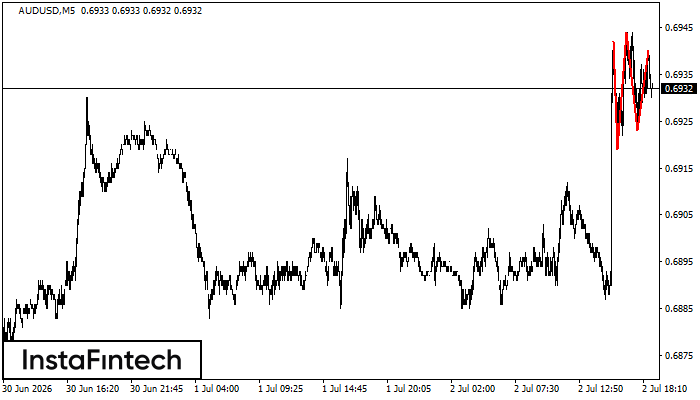
The Triple Top pattern has formed on the chart of the AUDUSD M5. Features of the pattern: borders have an ascending angle; the lower line of the pattern has the coordinates 0.6919/0.6923 with the upper limit 0.6942/0.6940; the projection of the width is 23 points. The formation of the Triple Top figure most likely indicates a change in the trend from upward to downward. This means that in the event of a breakdown of the support level of 0.6919, the price is most likely to continue the downward movement.
Bullish Symmetrical Triangle
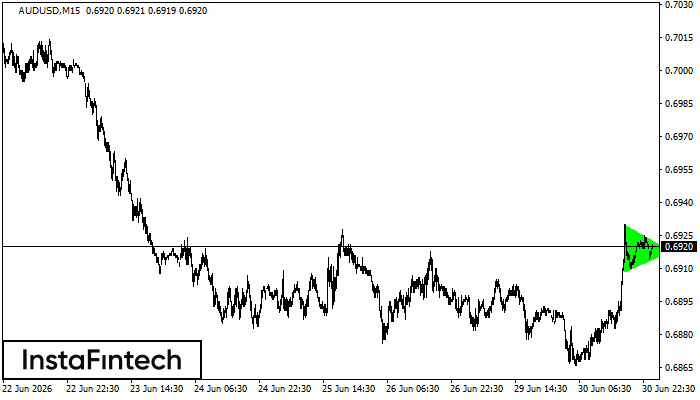
According to the chart of M15, AUDUSD formed the Bullish Symmetrical Triangle pattern. The lower border of the pattern touches the coordinates 0.6909/0.6918 whereas the upper border goes across 0.6930/0.6918. If the Bullish Symmetrical Triangle pattern is in progress, this evidently signals a further upward trend. In other words, in case the scenario comes true, the price of AUDUSD will breach the upper border to head for 0.6941.


