


FX.co ★ Modèles réels. Analyse technique et recommandations de trading
Modèles réels

Bearish Rectangle
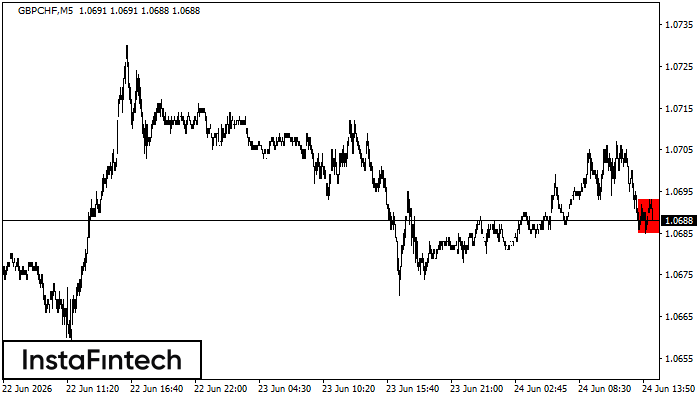
According to the chart of M5, GBPCHF formed the Bearish Rectangle which is a pattern of a trend continuation. The pattern is contained within the following borders: lower border 1.0685 – 1.0685 and upper border 1.0693 – 1.0693. In case the lower border is broken, the instrument is likely to follow the downward trend.
Double Bottom
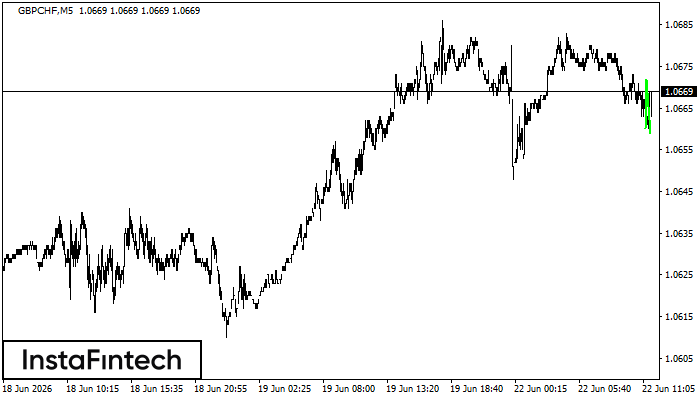
The Double Bottom pattern has been formed on GBPCHF M5. This formation signals a reversal of the trend from downwards to upwards. The signal is that a buy trade should be opened after the upper boundary of the pattern 1.0672 is broken. The further movements will rely on the width of the current pattern 12 points.
Bullish Rectangle
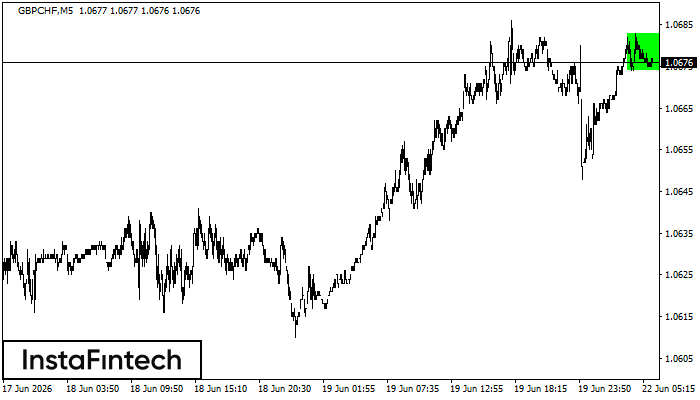
According to the chart of M5, GBPCHF formed the Bullish Rectangle. The pattern indicates a trend continuation. The upper border is 1.0683, the lower border is 1.0674. The signal means that a long position should be opened above the upper border 1.0683 of the Bullish Rectangle.
Triple Bottom
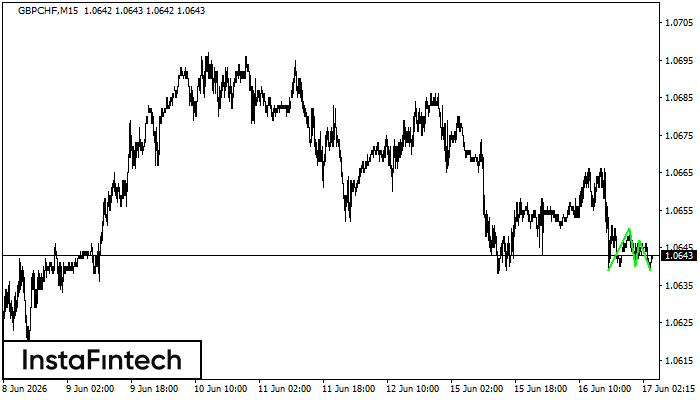
The Triple Bottom pattern has formed on the chart of the GBPCHF M15 trading instrument. The pattern signals a change in the trend from downwards to upwards in the case of breakdown of 1.0650/1.0647.
Bearish Rectangle
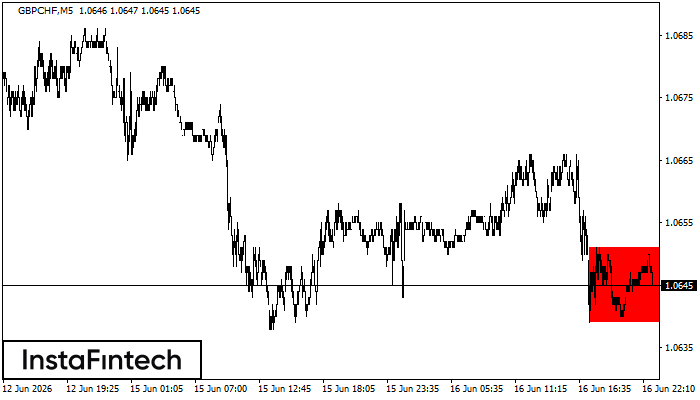
According to the chart of M5, GBPCHF formed the Bearish Rectangle which is a pattern of a trend continuation. The pattern is contained within the following borders: lower border 1.0639 – 1.0639 and upper border 1.0651 – 1.0651. In case the lower border is broken, the instrument is likely to follow the downward trend.


