


FX.co ★ Modèles réels. Analyse technique et recommandations de trading
Modèles réels

Bearish Symmetrical Triangle
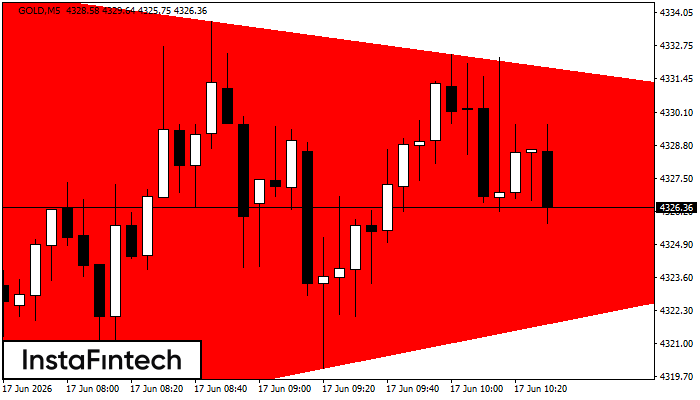
According to the chart of M5, GOLD formed the Bearish Symmetrical Triangle pattern. This pattern signals a further downward trend in case the lower border 4317.26 is breached. Here, a hypothetical profit will equal the width of the available pattern that is -1775 pips.
Double Bottom
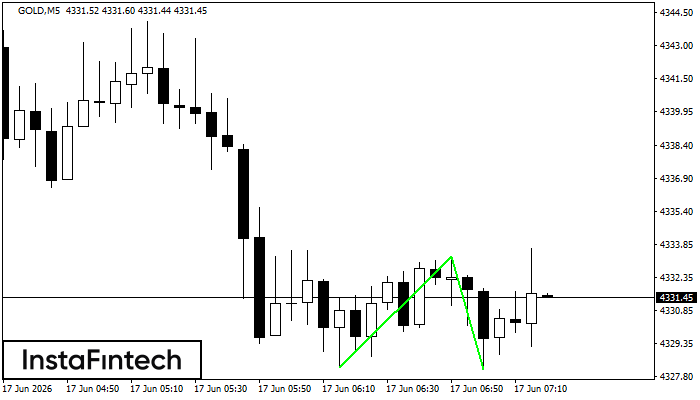
The Double Bottom pattern has been formed on GOLD M5; the upper boundary is 4333.30; the lower boundary is 4328.14. The width of the pattern is 508 points. In case of a break of the upper boundary 4333.30, a change in the trend can be predicted where the width of the pattern will coincide with the distance to a possible take profit level.
Double Top
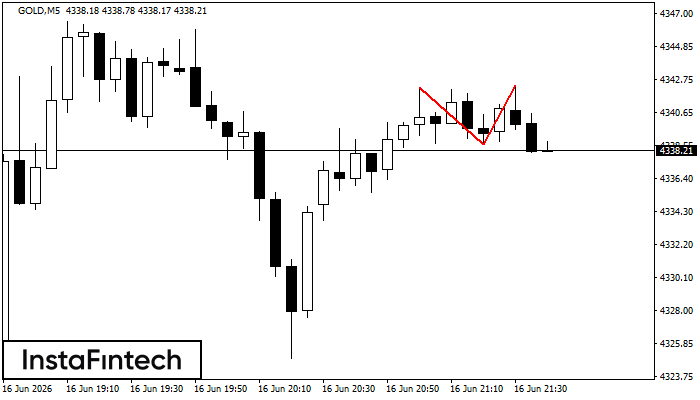
On the chart of GOLD M5 the Double Top reversal pattern has been formed. Characteristics: the upper boundary 4342.40; the lower boundary 4338.60; the width of the pattern 380 points. The signal: a break of the lower boundary will cause continuation of the downward trend targeting the 4338.45 level.
Triple Top
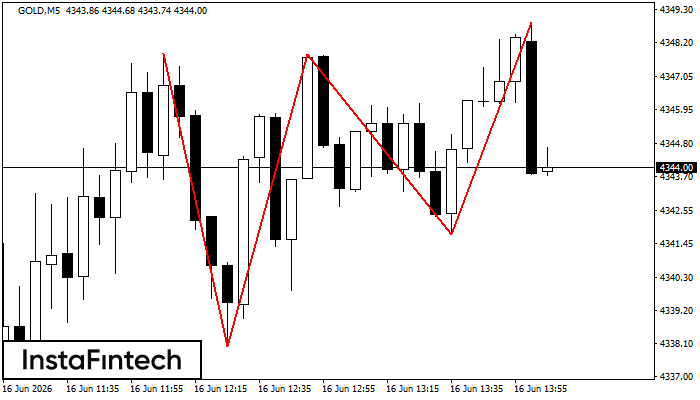
On the chart of the GOLD M5 trading instrument, the Triple Top pattern that signals a trend change has formed. It is possible that after formation of the third peak, the price will try to break through the resistance level 4337.99, where we advise to open a trading position for sale. Take profit is the projection of the pattern’s width, which is 985 points.
Double Bottom
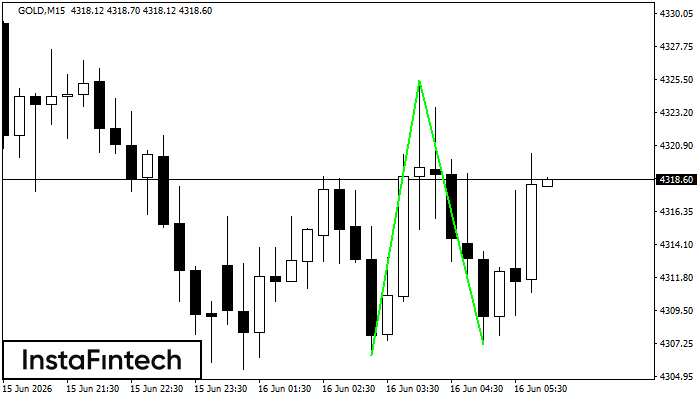
The Double Bottom pattern has been formed on GOLD M15; the upper boundary is 4325.41; the lower boundary is 4307.15. The width of the pattern is 1900 points. In case of a break of the upper boundary 4325.41, a change in the trend can be predicted where the width of the pattern will coincide with the distance to a possible take profit level.


