


FX.co ★ Modèles réels. Analyse technique et recommandations de trading
Modèles réels

Double Bottom

The Double Bottom pattern has been formed on #AMZN M30. This formation signals a reversal of the trend from downwards to upwards. The signal is that a buy trade should be opened after the upper boundary of the pattern 234.27 is broken. The further movements will rely on the width of the current pattern 295 points.
Double Bottom

The Double Bottom pattern has been formed on #AMZN M15; the upper boundary is 234.27; the lower boundary is 231.32. The width of the pattern is 295 points. In case of a break of the upper boundary 234.27, a change in the trend can be predicted where the width of the pattern will coincide with the distance to a possible take profit level.
Bearish pennant

The Bearish pennant pattern has formed on the #AMZN M30 chart. The pattern signals continuation of the downtrend in case the pennant’s low of 232.01 is broken through. Recommendations: Place the sell stop pending order 10 pips below the pattern’s low. Place the take profit order at the projection distance of the flagpole height.
Bearish pennant

The Bearish pennant pattern has formed on the #AMZN M5 chart. It signals potential continuation of the existing trend. Specifications: the pattern’s bottom has the coordinate of 246.63; the projection of the flagpole height is equal to 347 pips. In case the price breaks out the pattern’s bottom of 246.63, the downtrend is expected to continue for further level 246.48.
Bullish Rectangle
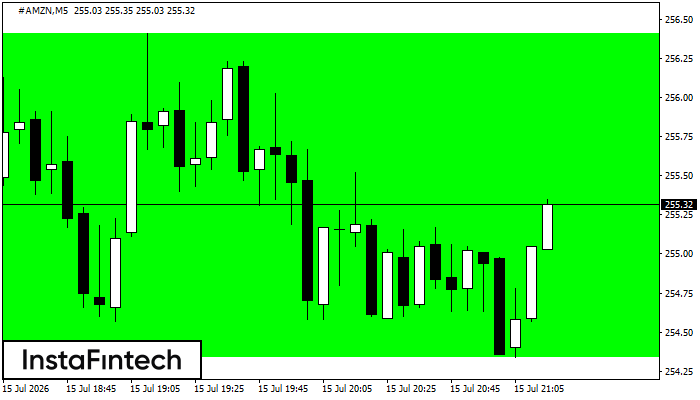
According to the chart of M5, #AMZN formed the Bullish Rectangle. This type of a pattern indicates a trend continuation. It consists of two levels: resistance 256.41 and support 254.34. In case the resistance level 256.41 - 256.41 is broken, the instrument is likely to follow the bullish trend.


