


FX.co ★ Modèles réels. Analyse technique et recommandations de trading
Modèles réels

Bearish Symmetrical Triangle
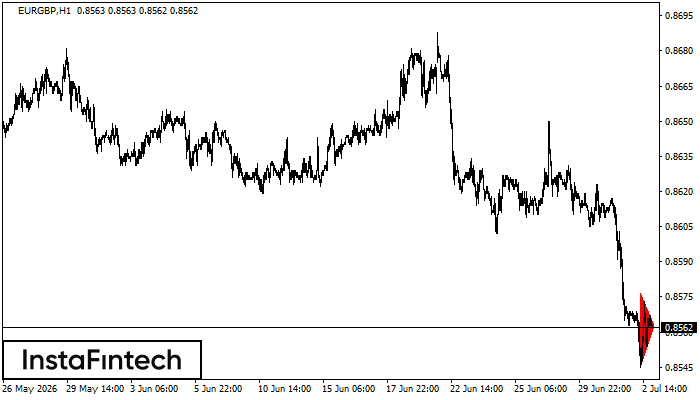
According to the chart of H1, EURGBP formed the Bearish Symmetrical Triangle pattern. Description: The lower border is 0.8545/0.8563 and upper border is 0.8577/0.8563. The pattern width is measured on the chart at -32 pips. The formation of the Bearish Symmetrical Triangle pattern evidently signals a continuation of the downward trend. In other words, if the scenario comes true and EURGBP breaches the lower border, the price could continue its move toward 0.8523.
Bearish Symmetrical Triangle
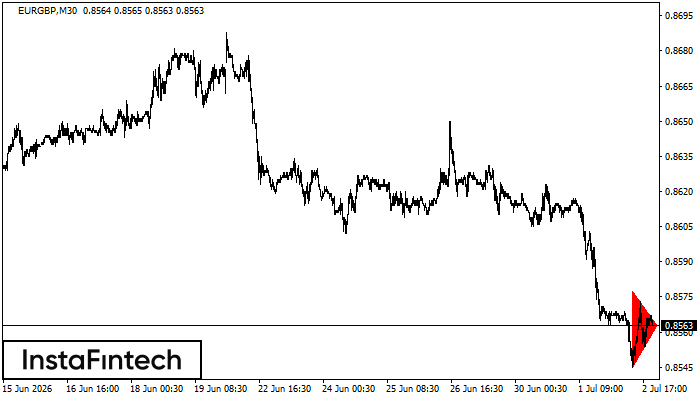
According to the chart of M30, EURGBP formed the Bearish Symmetrical Triangle pattern. This pattern signals a further downward trend in case the lower border 0.8545 is breached. Here, a hypothetical profit will equal the width of the available pattern that is -33 pips.
Bearish Symmetrical Triangle
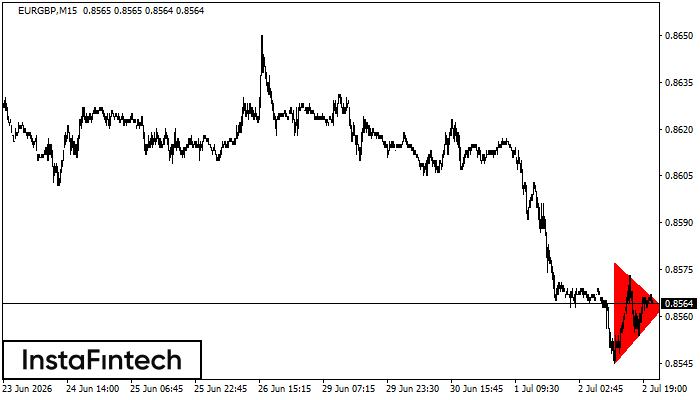
According to the chart of M15, EURGBP formed the Bearish Symmetrical Triangle pattern. This pattern signals a further downward trend in case the lower border 0.8545 is breached. Here, a hypothetical profit will equal the width of the available pattern that is -32 pips.
Triple Bottom
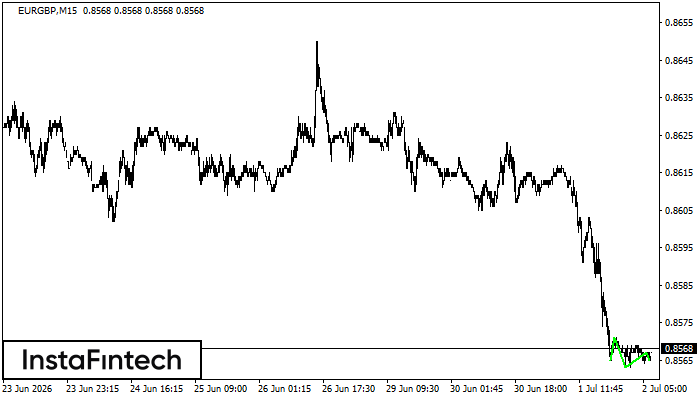
The Triple Bottom pattern has been formed on EURGBP M15. It has the following characteristics: resistance level 0.8571/0.8567; support level 0.8565/0.8565; the width is 6 points. In the event of a breakdown of the resistance level of 0.8571, the price is likely to continue an upward movement at least to 0.8586.
Bearish pennant
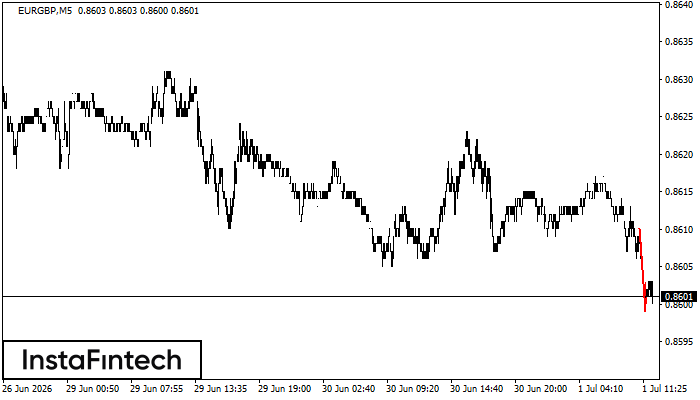
The Bearish pennant pattern has formed on the EURGBP M5 chart. This pattern type is characterized by a slight slowdown after which the price will move in the direction of the original trend. In case the price fixes below the pattern’s low of 0.8599, a trader will be able to successfully enter the sell position.


