


FX.co ★ Modèles réels. Analyse technique et recommandations de trading
Modèles réels

Double Bottom
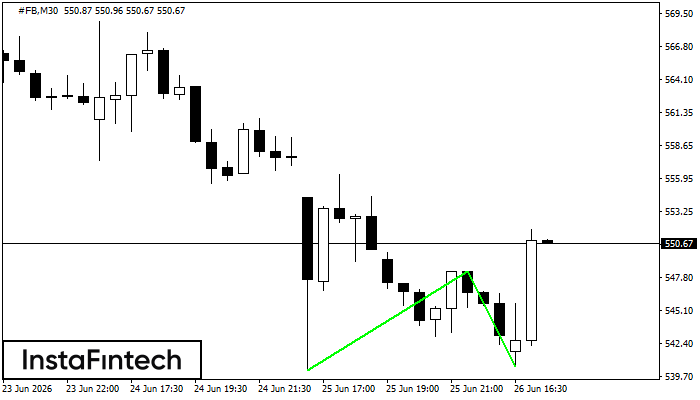
The Double Bottom pattern has been formed on #FB M30; the upper boundary is 548.37; the lower boundary is 540.53. The width of the pattern is 814 points. In case of a break of the upper boundary 548.37, a change in the trend can be predicted where the width of the pattern will coincide with the distance to a possible take profit level.
Double Bottom
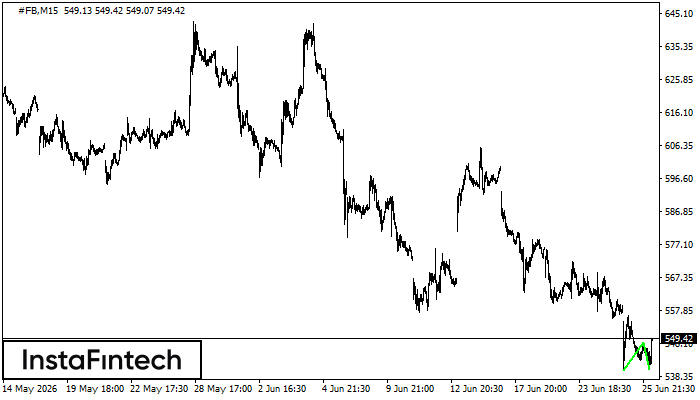
The Double Bottom pattern has been formed on #FB M15; the upper boundary is 548.37; the lower boundary is 540.53. The width of the pattern is 814 points. In case of a break of the upper boundary 548.37, a change in the trend can be predicted where the width of the pattern will coincide with the distance to a possible take profit level.
Triple Bottom
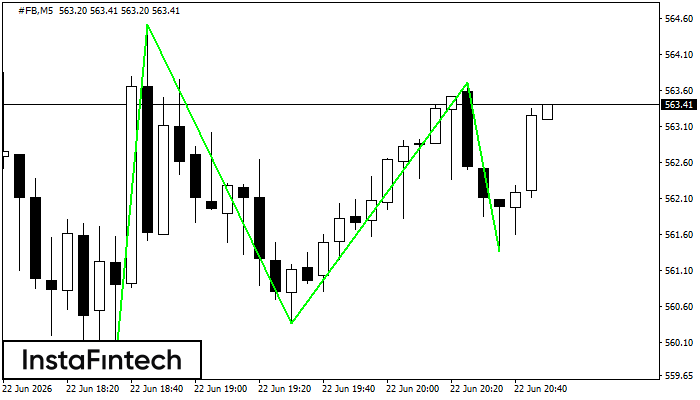
The Triple Bottom pattern has formed on the chart of the #FB M5 trading instrument. The pattern signals a change in the trend from downwards to upwards in the case of breakdown of 564.51/563.71.
Bearish Symmetrical Triangle
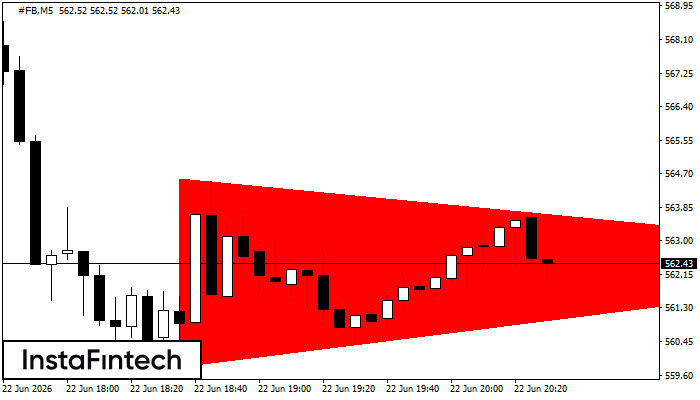
According to the chart of M5, #FB formed the Bearish Symmetrical Triangle pattern. Trading recommendations: A breach of the lower border 559.81 is likely to encourage a continuation of the downward trend.
Bullish Flag
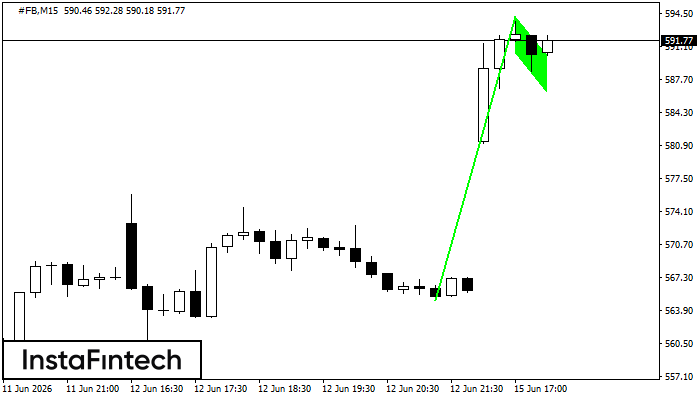
The Bullish Flag pattern which signals continuation of a trend has been formed on the chart #FB M15. Forecast: if the price breaks above the pattern high at 594.26, then traders will be able to place a long deal with the target at 594.48.


