


FX.co ★ Modèles réels. Analyse technique et recommandations de trading
Modèles réels

Bearish Symmetrical Triangle

According to the chart of M5, EURUSD formed the Bearish Symmetrical Triangle pattern. This pattern signals a further downward trend in case the lower border 1.1402 is breached. Here, a hypothetical profit will equal the width of the available pattern that is -10 pips.
Double Bottom

The Double Bottom pattern has been formed on EURUSD H1. Characteristics: the support level 1.1424; the resistance level 1.1442; the width of the pattern 18 points. If the resistance level is broken, a change in the trend can be predicted with the first target point lying at the distance of 19 points.
Double Bottom

The Double Bottom pattern has been formed on EURUSD M30; the upper boundary is 1.1444; the lower boundary is 1.1423. The width of the pattern is 20 points. In case of a break of the upper boundary 1.1444, a change in the trend can be predicted where the width of the pattern will coincide with the distance to a possible take profit level.
Bullish Symmetrical Triangle
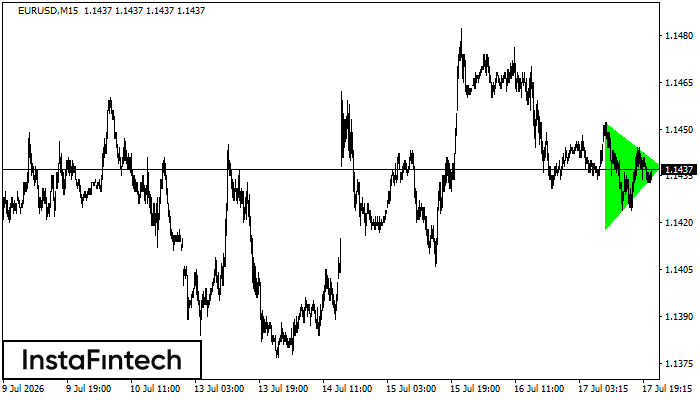
According to the chart of M15, EURUSD formed the Bullish Symmetrical Triangle pattern. The lower border of the pattern touches the coordinates 1.1418/1.1438 whereas the upper border goes across 1.1452/1.1438. If the Bullish Symmetrical Triangle pattern is in progress, this evidently signals a further upward trend. In other words, in case the scenario comes true, the price of EURUSD will breach the upper border to head for 1.1460.
Double Bottom
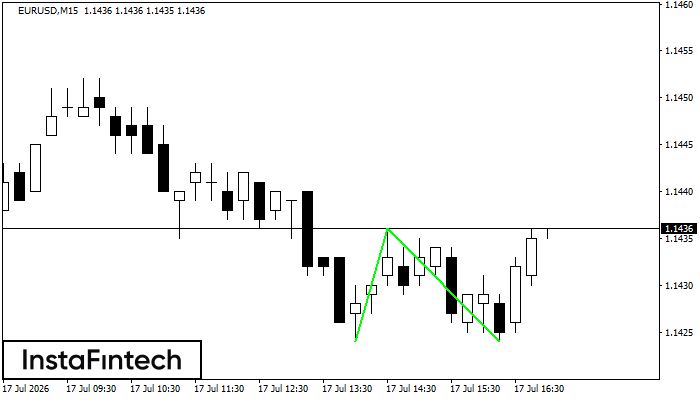
The Double Bottom pattern has been formed on EURUSD M15; the upper boundary is 1.1436; the lower boundary is 1.1424. The width of the pattern is 12 points. In case of a break of the upper boundary 1.1436, a change in the trend can be predicted where the width of the pattern will coincide with the distance to a possible take profit level.


