
















FX.co ★ Modèles réels. Analyse technique et recommandations de trading
Modèles réels




Triangle symétrique haussier
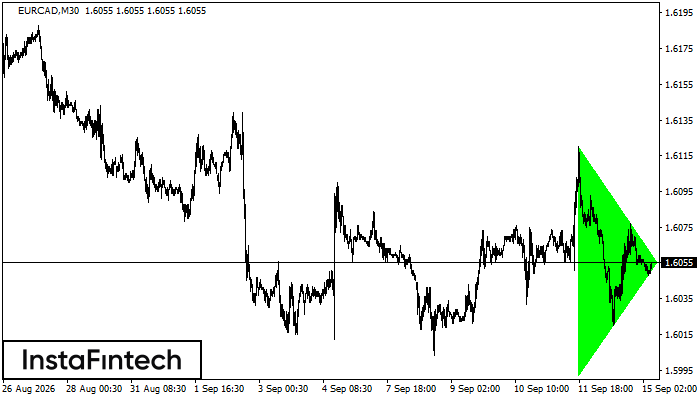
Sur le graphique M30, EURCAD a formé la figure « Triangle symétrique haussier », qui signale une poursuite de tendance. La limite supérieure passe par 1.6120/1.6055 et la limite inférieure par 1.5992/1.6055. La largeur de la figure est de 128 points. Dans une tendance haussière, la formation de « Triangle symétrique haussier » suggère la poursuite du mouvement. En cas de franchissement de 1.6055, le cours pourrait évoluer vers 1.6085.
Double creux
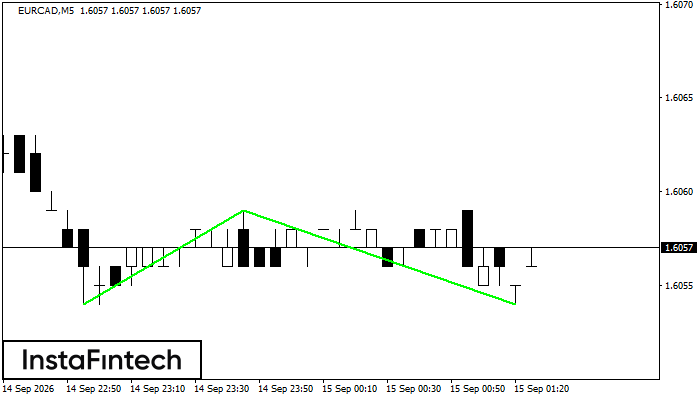
La figure « Double creux » s’est formée sur EURCAD M5. Le support se situe à 1.6054, la résistance à 1.6059 et la largeur de la figure est de 5 points. Le franchissement de la résistance pourrait signaler un retournement, avec un premier objectif à une distance de 5 points.
REGISTER
on the forum for traders
AND EARN MONEY!
S'inscrire maintenanton the forum for traders
AND EARN MONEY!
Double creux
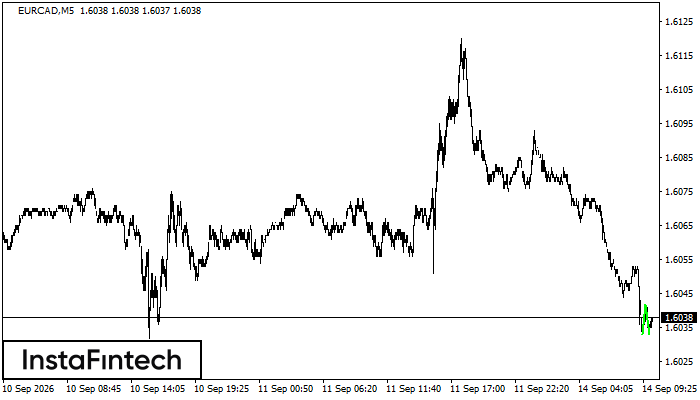
La figure « Double creux » s’est formée sur EURCAD M5 et signale un retournement de la tendance baissière vers une tendance haussière. Une position longue peut être envisagée après le franchissement de la limite supérieure 1.6042. La largeur actuelle de la figure, soit 9 points, sert à projeter l’amplitude du prochain mouvement.
Triple sommet
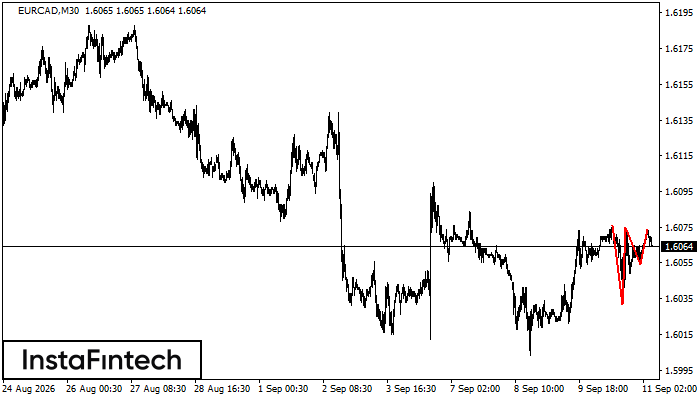
La figure de retournement « Triple sommet » s’est formée sur le graphique EURCAD M30. La limite supérieure passe par 1.6076/1.6074, la limite inférieure par 1.6032/1.6054 et la largeur actuelle est de 21 points. Si le support de confirmation à 1.6032 est franchi, cette largeur peut servir à projeter le mouvement baissier.
Double sommet
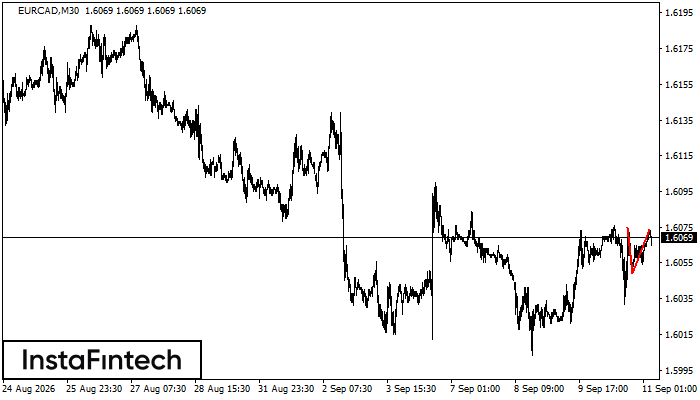
La figure « Double sommet » s’est formée sur EURCAD M30 et signale un passage possible d’une tendance haussière à une tendance baissière. Si la base à 1.6049 est franchie, le mouvement baissier devrait se poursuivre.


