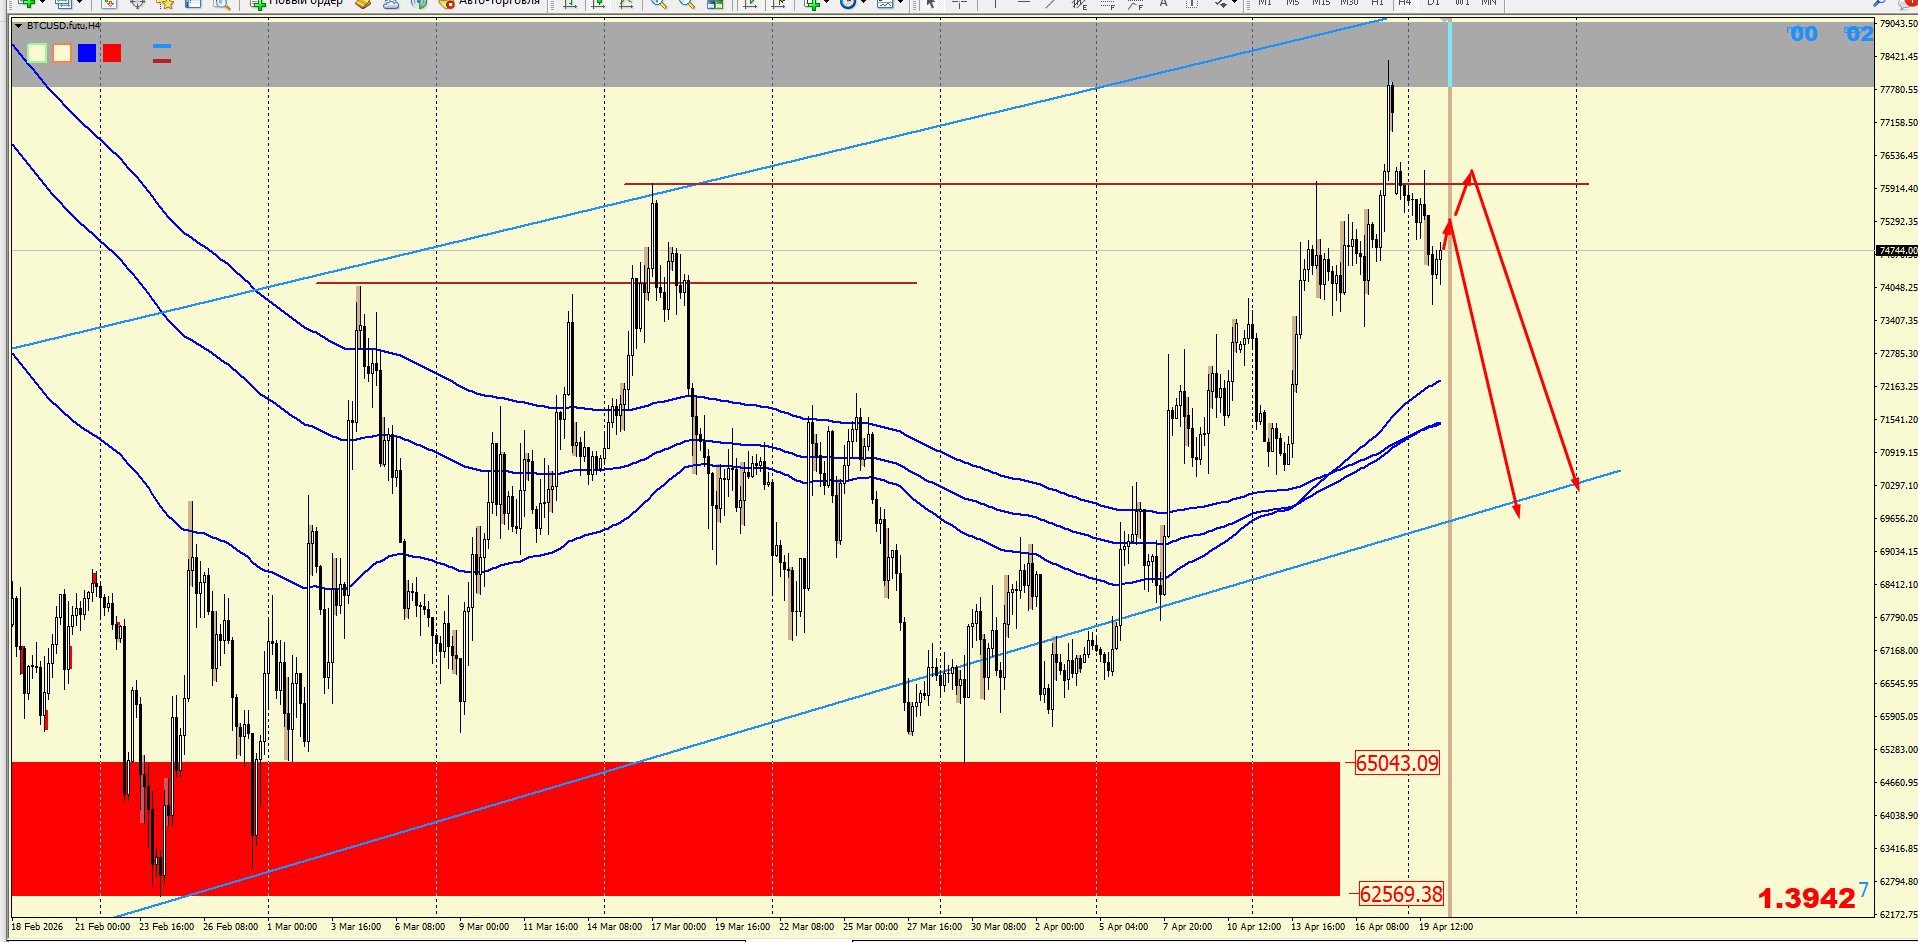

Hello traders, #Bitcoin continues to trade within an ascending channel on lower timeframes. Currently, the price has reached the grey resistance line and simultaneously hit the upper boundary of the ascending channel. A decrease to the lower channel boundary or a sideways movement for relief is expected. Considering that before a strong Bitcoin movement, stops are often triggered, spikes occur, and unnecessary passengers are shaken out, a significant downward movement is not ruled out. I will only consider growth after breaking through the grey level. So, for now, it's sales. Last week, I mentioned that I was looking for them from the grey level. On the four-hour chart, the price is within the ascending channel. It has reached the upper zone, waiting for a pullback. The daily chart clearly shows that the ascending channel on lower timeframes is nothing but a retracement during a decline. To achieve full growth, lows need to be removed.


