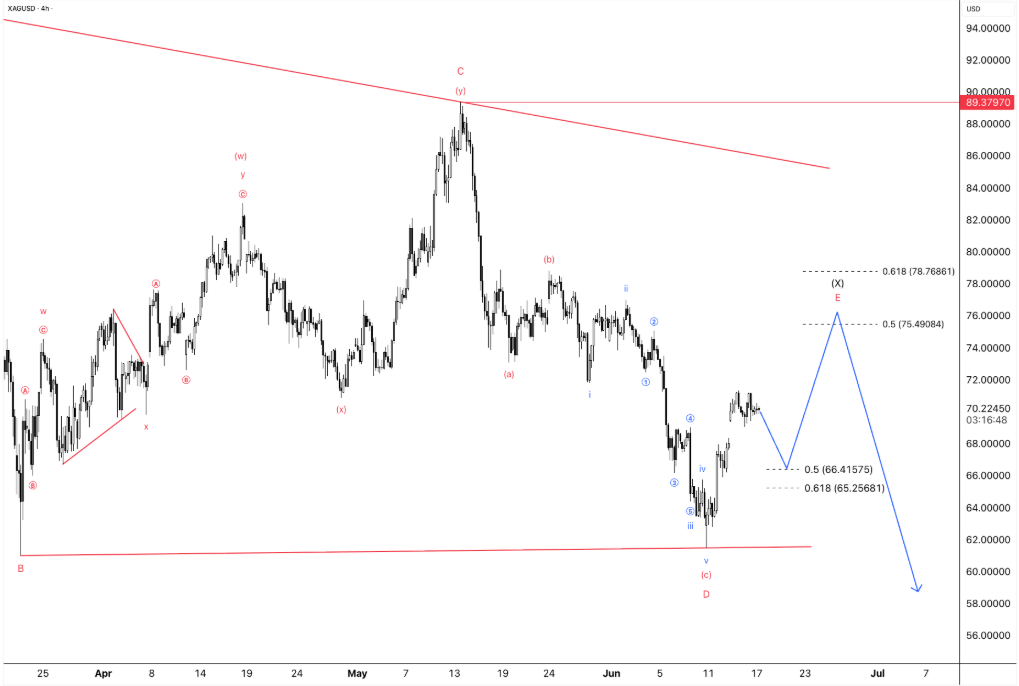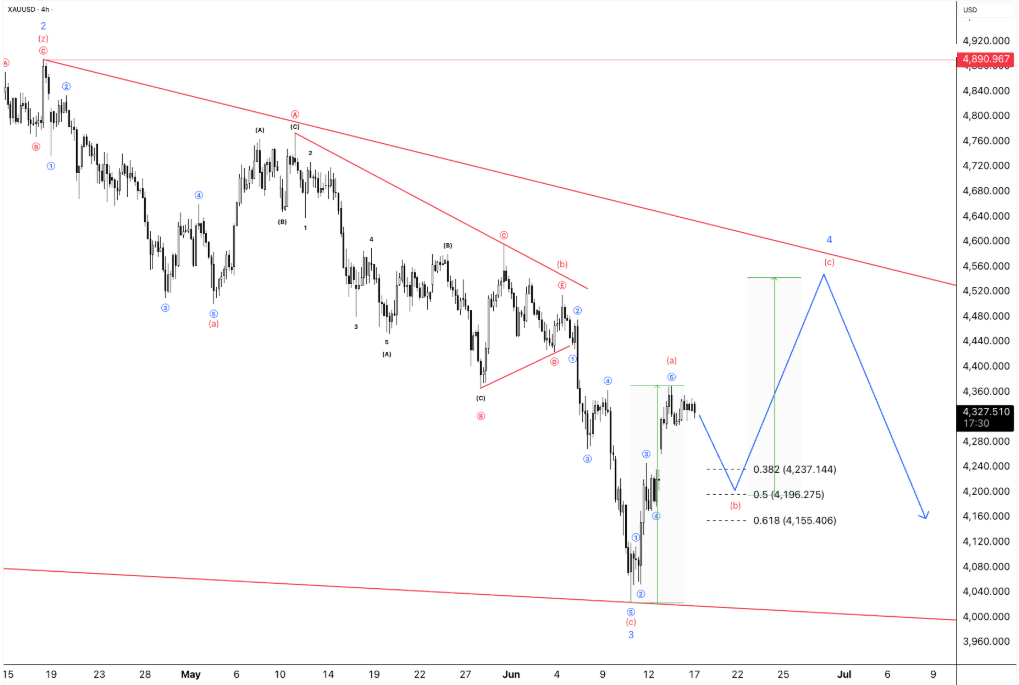
GOLD H4 The main wave (3) ended near 4040 on June 12th. The correction of wave (4) is ongoing, with a potential return to levels of 4237.144 (0.382), 4196.275 (0.5), or 4155.406 (0.618) before a reversal. Within the system, wave (4) is considered to be a zigzag (a-b-c), with (c) targeting the descending channel boundary in early July. Cancellation at 4890.967. Gold completed the main wave (3) at the beginning of June, and wave (4) is currently tracking a corrective bounce within a descending channel. The price is at 4327.510, in the middle of a structure that appears to be a three-wave (a)-(b)-(c) pattern. The green forecast indicates that (c) is moving upwards towards the upper channel boundary around the end of June, corresponding to the target zone of about 4560. The three Fibonacci levels determine the likely correction level (b): 0.382 at 4237.144, 0.5 at 4196.275, and 0.618 at 4155.406. Watch for the price to drop into this range before (c) rises to the channel's peak. Wave (4) should stay below the channel ceiling and, importantly, below 4890.967. After the completion of (4), wave (5) downwards is the final stage of the sequence from the April highs, with the projection arrow pointing to a significantly lower zone by mid-July. This is a working hypothesis. Above 4890.967, the entire bearish scenario from the peak collapses. SILVER H4 Silver completed a significant corrective rally W-X-Y in wave C/(y) near 89.37970. From this peak, a five-wave downward impulse ended at wave D, with visible sub-waves i-v. The price is currently bouncing in wave (X), expected to stop between the 0.5 (75.49084) and 0.618 (78.76861) correction zones before a final decline in wave E. Cancellation at 89.37970. Last week, silver completed the D-wave impulse. Five waves have been completed from the C/(y) peak, with wave iii reaching a low near the June 11-12 lows, and wave v completing the sequence. The current bounce is wave (X), already moving into the correction zone between 75.49084 and 78.76861. It is in this range that sellers need to regain control. Above 78.76861, the bounce becomes unstable. Closing above 89.37970 completely cancels this count. As long as the price remains below the designated cancellation level, the forecast points to a decline in wave E, significantly undercutting the D-wave low, corresponding to the completion of a broader narrowing triangle structure visible on the chart. The bounce (X) is expected to end by the end of June or early July, considering the pace of recent fluctuations on H4. The blue forecast arrow confirms the direction: a decline until early July before this structure completes.