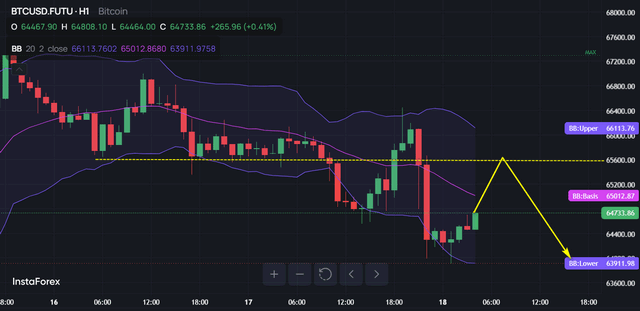
Hello everyone! On the hourly chart of Bitcoin, as I predicted at the beginning of the week, a classic downtrend is developing. However, with the lower Bollinger Band being reached, the cryptocurrency has become oversold, so a rebound is possible. Bulls will try to even break through the middle Bollinger Band, as on Friday a peace agreement will be signed between Iran and the USA in Switzerland, but bears may stop them at the $65K resistance. The problem for cryptocurrencies is that peace with Iran involves lifting sanctions. This will also affect the unlocking of Bitcoin. And since dollar payments will become available again, Iran will sell its BTC in significant volume. Therefore, I expect a breakthrough of the $64K support in the near future.


